
Figure 3.
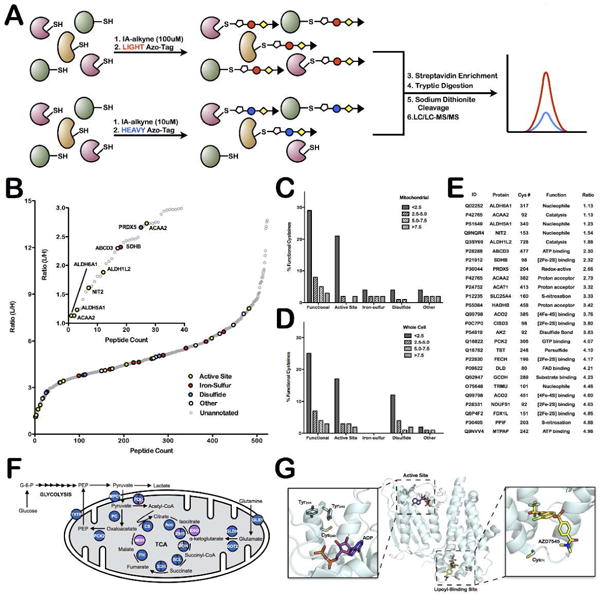
Quantitative-MS analysis of mitochondrial proteins identifies hyper-reactive and functional cysteine residues. (A) Schematic representation of workflow to rank cysteines by reactivity. (B) L/H ratio plot for all mitochondrial cysteine-containing peptides. Functional cysteines are displayed in bold, colored circles (based on function) while unannotated cysteines are displayed as light, gray circles. Inset shows those cysteine residues with ratios less than 3 (ie. hyper-reactive cysteine residues). (C and D) Analysis of the relationship between functional annotation and reactivity in (C) current mitochondrial dataset and (D) previously published whole-cell lysate data from Weerapana et al. Nature 201025. Data are divided into generally functional, active-site, iron-sulfur ligating, disulfide-bond forming, or other and into reactivity bins; L/H ratio less than 2.5, between 2.5 and 5.0, between 5.0 and 7.5, and greater than 7.5. (E) List of identified functional mitochondrial reactive cysteine residues. Only cysteine residues with L/H ratios below 5 are included. (F) Schematic of the TCA cycle proteins that are identified in mitochondrial enriched samples (blue circles), a handful are also found in whole cell samples (purple circles) or not at all (white circles). Detailed information on identified cysteine-labeled TCA-cycle peptides is presented in Supplemental Table 11. (G) Structure of the ATP and lipoyl binding sites of pyruvate dehydrogenase kinase 2 (PDK2) (PDB = 2Q8F).