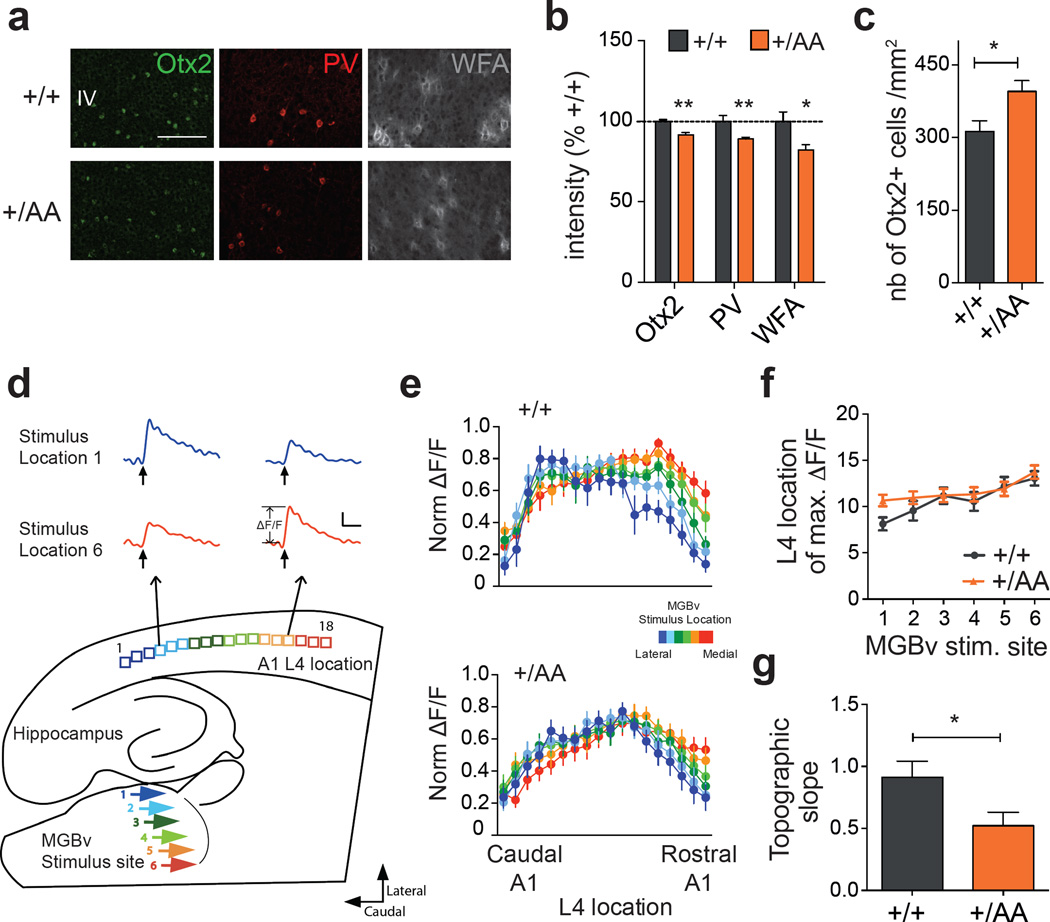
Figure 2.
Delayed auditory plasticity in Otx2+/AA mice. (a) Representative images of Otx2, PV and WFA staining in primary auditory cortex (A1) layer IV (L4) at P20 (scale bar: 100 µm). (b, c) Staining intensity of Otx2, PV and WFA (b, N=4–7 mice per group) and number of Otx2+ cells (c, N=5–8 mice per group) in A1 L4 at P20. (d) Illustration of thalamocortical brain slice preparation to study auditory plasticity (representative traces from a WT slice, scale bar: 100 msec, 0.05 ΔF/F). (e) Normalized (norm.) maximal ΔF/F across L4 loci in response to different ventral medial geniculate body (MGBv) stimulus sites for WT (N=13, p<0.0001 for stimulus location, 2-way ANOVA) and Otx2+/AA (N=18, p=0.0986 for stimulus location) mice exposed to a 7 kHz tone between P16–20. (f-g) Topographic slope calculated from location of maximal ΔF/F across L4 loci in response to different MGBv stimulus sites 1–6. (All values: mean ± SEM; t-test; *p < 0.05, **p < 0.01).

