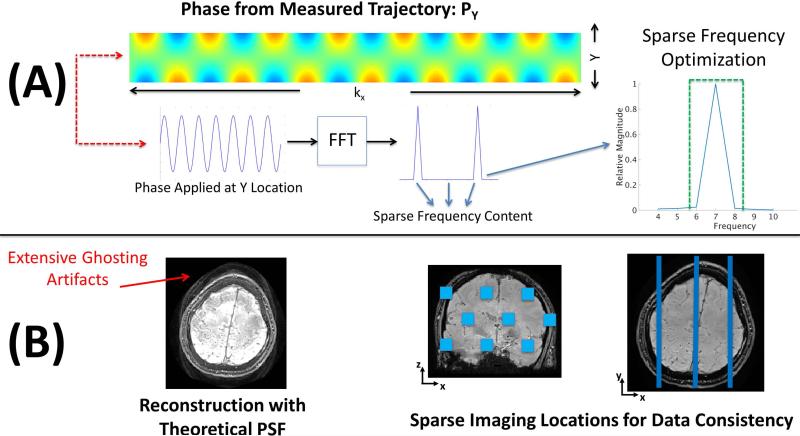
Figure 2.
(A) shows an example of a measured PSF calculated using fully sampled calibration scans. The phase is computed by taking the hybrid space ratio of an acquisition with no wave gradients and one with the Y wave gradient employed. The measured PSF only requires a sparse number of frequencies to be represented accurately. (B) shows an example of ghosting artifacts in the presence of trajectory errors. Here, the theoretical PSF is used to reconstruct the image. Distribution of SENSE test locations are shown on the right. As the ghosting artifacts appear globally, only a small number of parallel imaging test locations are required to guide the optimization.

