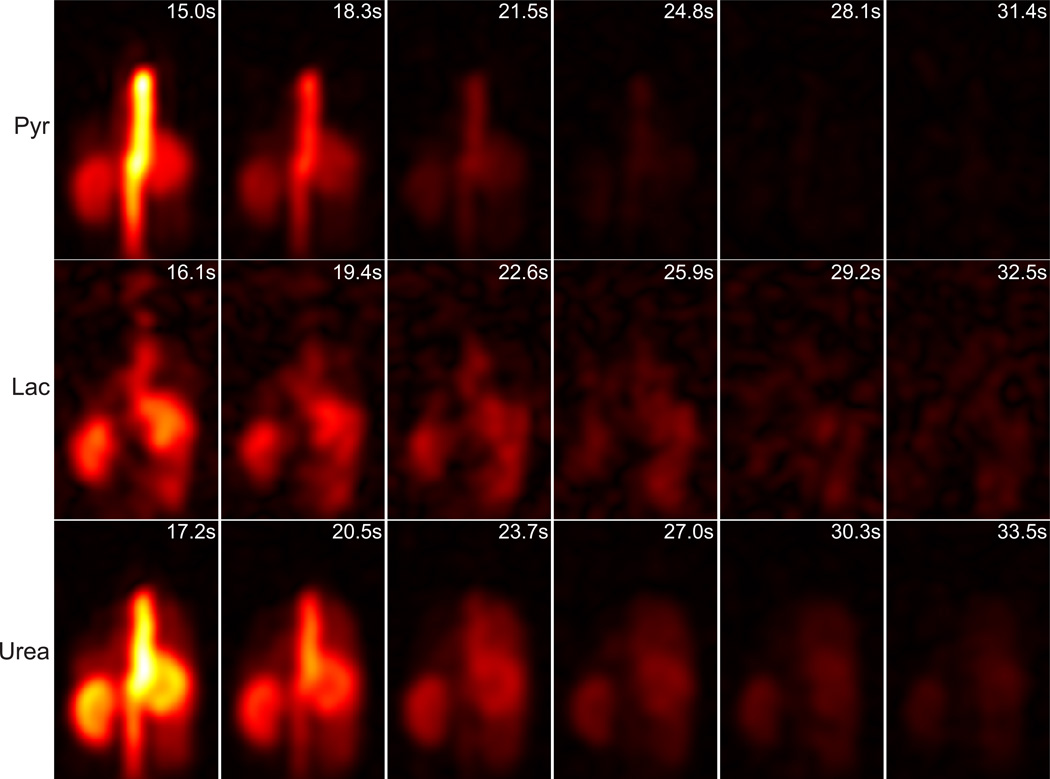
Figure 10.
Same data as in Fig. 9 but displaying all time points at one coronal slice containing kidney and aorta (third slice from left in Fig. 9). Lactate images are displayed with 3× scaling factor compared to pyruvate. The time stamps are relative to starting time of injection and estimated based on average respiratory rate of 55/min, labeled on each image.

