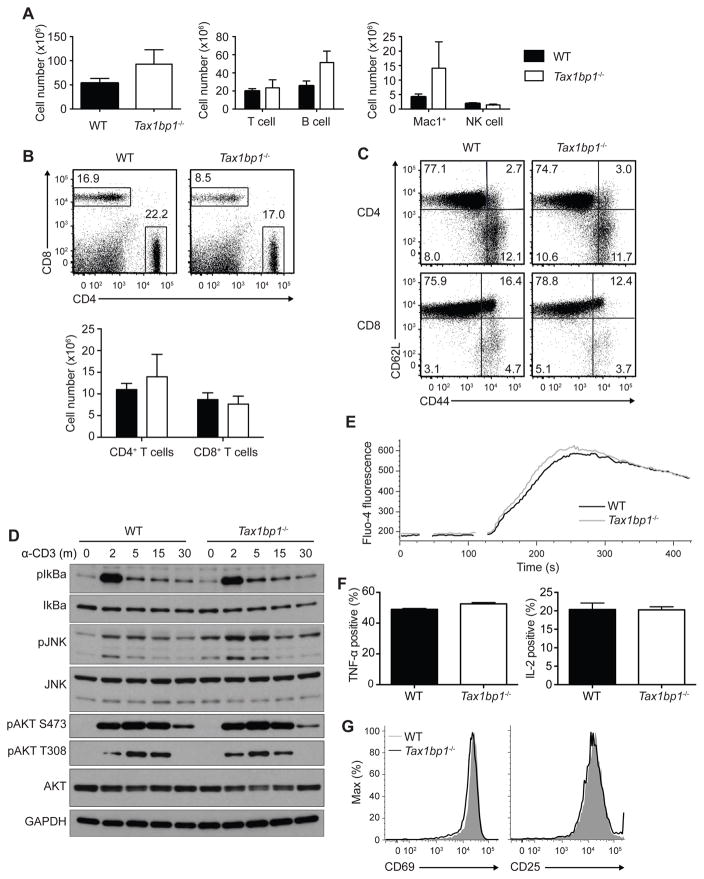
Figure 1. Immunophenotype of Tax1bp1−/− Mice and Proximal T Cell Functions.
(A) Quantification of total splenocytes (left panel), splenic T cells (TCRb+) and B cells (CD19+) (middle panel), and myeloid cells (Mac-1+), and NK cells (NK1.1+ CD3−) from untreated WT and Tax1bp1−/− mice. Error bars reflect mean values ± SD.
(B) Representative flow cytometry (upper panel) and quantification (lower panel) of splenic CD4+ and CD8+ T cells from WT and Tax1bp1−/− mice.
(C) Flow cytometric analysis of CD62L and CD44 expression on CD4+ (upper panels) and CD8+ T cells (lower panels) from indicated mice.
(D) Immunoblot analyses of signaling molecules from CD4+ T cells from indicated mice at indicated times after anti-CD3 stimulation.
(E) Fluorometric analysis of acute calcium signaling in CD4+ T cells from indicated mice. Data are representative of two experiments.
(F) Intracellular quantification of TNF-α (left graph) and IL-2 (right graph) production 7 h and 19 h, respectively, after anti-CD3 and anti-CD28 stimulation. Mean values ± SD.
(G) Cell surface expression of activation markers, CD69 and CD25, 24 h after anti-CD3 and anti-CD28 stimulation. Unless otherwise noted, all data presented here and hereafter are representative of at least three independent experiments. Please see also Figure S1.

