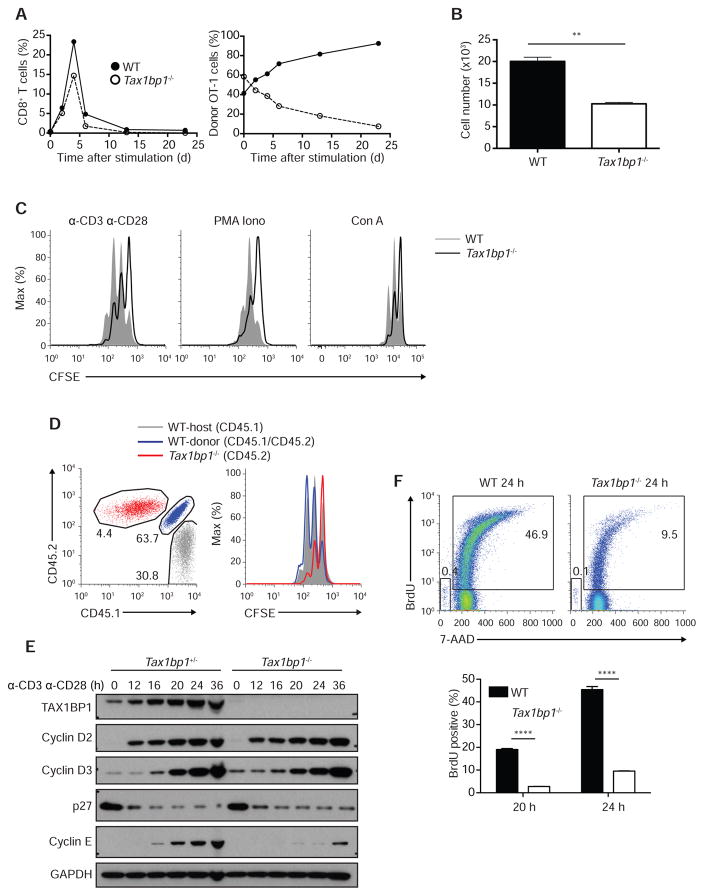
Figure 2. T Cell Proliferation Defects in the Absence of TAX1BP1.
(A) Quantitation of congenically marked antigen specific WT OT-I and Tax1bp1−/− OT-I T cells after in vivo immunization. Congenically marked WT OT-I and Tax1bp1−/− OT-I T cells were adoptively co-transferred into the same congenically distinct hosts, after which mice were immunized with LPS plus ovalbumin. Mice were sacrificed at the indicated days after immunization and the percentage of total splenic CD8+ T cells that were WT OT-I and Tax1bp1−/− OT-I T cells were plotted (left graph). The relative percentage of total OT-I T cells that were either WT OT-I or Tax1bp1−/− OT-I T cells is also plotted (right graph). Data are representative of two experiments.
(B) Live cell counts of WT and Tax1bp1−/− CD4+ T cells stimulated in vitro with anti-CD3 and anti-CD28 for 2 d. Equal numbers of cells were stimulated for each genotype. Mean values ± SD. **p < 0.01 by two-tailed unpaired t-test.
(C) CFSE dilution histograms of WT and Tax1bp1−/− CD4+ T cells stimulated with anti-CD3 and anti-CD28 antibodies, PMA and ionomycin, or concanavalin A for 2 d.
(D) CFSE dilution histograms of CD4+ T cells isolated from mixed bone marrow chimera mice stimulated as in (B). WT mice were sublethally irradiated and reconstituted with both indicated congenic strains of WT and Tax1bp1−/− CD4+ T cells. T cells from these mixed radiation chimera were then stimulated together in vitro. Flow cytometric gating of three distinct genotypes of CD4+ T cells shown in left panel; CFSE dilution of the gated populations shown in right panel. Data are representative of two experiments.
(E) Immunoblot analyses of the indicated cell cycle proteins from Tax1bp1+/− and Tax1bp1−/− CD4+ T cells. Cells were stimulated as in (B), and harvested at the indicated time points for immunoblot analyses.
(F) Flow cytometric analyses of BrdU incorporation by WT and Tax1bp1−/− CD4+ T cells 24 hours after stimulation as in (B). Representative flow cytometry of BrdU and 7AAD staining shown in upper panels. Quantitation of %BrdU+ cells is shown in lower panels. Mean values ± SD. ****p < 0.0001 by two-way ANOVA with Tukey’s test. Please see also Figure S2.

