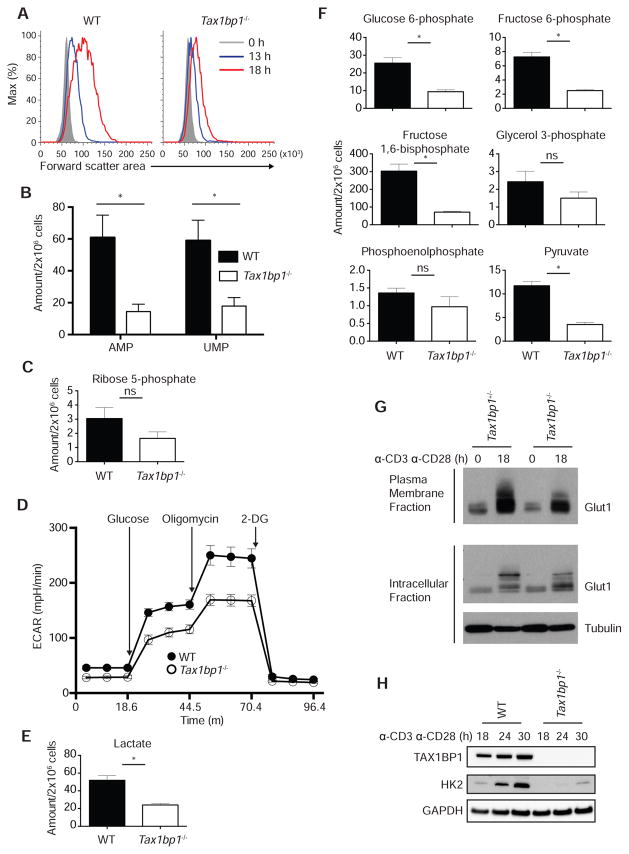
Figure 3. Metabolic Defects in Tax1bp1−/− T Cells.
(A) Representative flow cytometric analysis of cell size by forward scatter area of WT and Tax1bp1−/− CD4+ T cells stimulated with anti-CD3 and anti-CD28 antibodies.
(B) Quantification of AMP and UMP in WT and Tax1bp1−/− CD4+ T cells by mass spectrometry 24 h after stimulation as in (A). (B, C, E, F) Mean values ± SEM. ns = not significant, *p < 0.05 by unpaired t-test corrected for multiple comparisons using Sidak-Bonferroni method. (B, C, E, and F) Data are representative of two experiments.
(C) Mass spectrometric quantification of ribose 5-phosphate as in (B).
(D) Seahorse assay of extracellular acidification rate of WT and Tax1bp1−/− CD4+ T cells simulated as in (A) for 24 h in the basal state and in response to sequential treatment with glucose, oligomycin and 2-DG. Mean values ± SD.
(E) Mass spectrometric quantification of lactate as in (B).
(F) Mass spectrometric quantification of glycolytic intermediates as in (B).
(G) Immunoblot analysis of Glut1 expression in plasma membrane (above) or intracellular (below) fractions of Tax1bp1+/− and Tax1bp1−/− CD4+ T cells before and 18 h after stimulation as in (A). Data are representative of two experiments.
(H) Immunoblot analyses of hexokinase 2 expression in WT and Tax1bp1−/− CD4+ T cells at indicated time points after stimulation as in (A).

