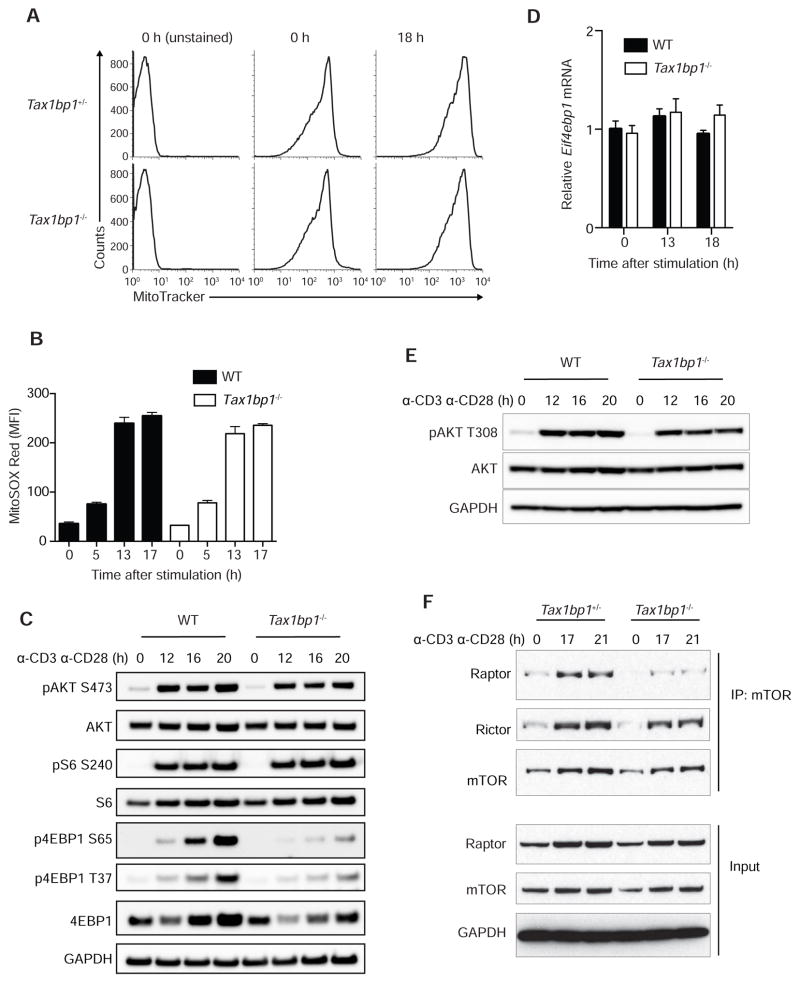
Figure 4. TAX1BP1 Supports mTOR Signaling in T Cells.
(A) Mitochondrial content in resting and activated Tax1bp1+/− and Tax1bp1−/− CD4+ T cells assessed by MitoTracker Green labeling. Cells were stimulated with anti-CD3 and anti-CD28 antibodies. Data are representative of two experiments.
(B) Mitochondrial ROS in resting and activated WT and Tax1bp1−/− T cells assessed by MitoSOX Red labeling in cells stimulated as in (A). Mean values ± SD.
(C) Immunoblot analyses of mTOR signaling proteins in WT and Tax1bp1−/− CD4+ T cells stimulated as in (A).
(D) Real-time quantitative PCR analyses of Eif4bp1 mRNA expression normalized to Hprt mRNA in WT and Tax1bp1−/− CD4+ T cells stimulated as in (A). Mean values ± SD. Data are representative of two experiments.
(E) Immunoblot analyses of AKT phosphorylation (phospho-Thr308 AKT) from stimulated WT and Tax1bp1−/− CD4+ T cells at the indicated time points.
(F) Immunoprecipitation and immunoblot analysis of mTORC1 and mTORC2 complexes in stimulated Tax1bp1+/− and Tax1bp1−/− CD4+ T cells at the indicated time points. Please see also Figure S3.

