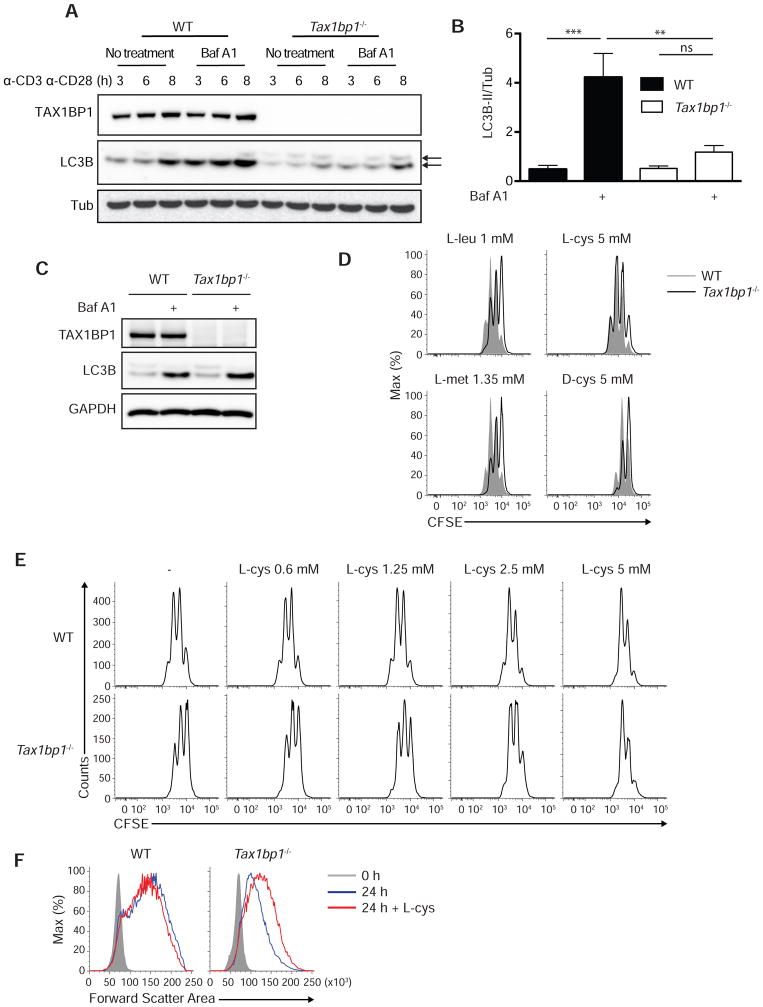
Figure 5. L-cysteine Rescues Tax1bp1−/− T Cell Size and Proliferation.
(A) Immunoblot analysis of LC3B lipidation (autophagy flux) in WT and Tax1bp1−/− CD4+ T cells stimulated with anti-CD3 and anti-CD28 for the indicated time periods. Bafilomycin A1 was added in the indicated samples during the final 20 min prior to harvest. Upper arrow indicates LC3B-I and lower arrow indicates LC3B-II.
(B) Quantification of LC3B-II lipidation normalized to Tubulin protein at 3 h after stimulation as in (A). Mean values ± SD. **p < 0.01 and ***p < 0.001 by two-way ANOVA with Tukey’s test.
(C) Immunoblot analysis of LC3B lipidation in WT and Tax1bp1−/− CD4+ T cells. Cells were cultured in HBSS for 1.5 h and Baf A1 was added in the indicated samples during the final 20 min. Data are representative of two experiments.
(D) CFSE dilution of WT or Tax1bp1−/− CD4+ T cells stimulated as in (A) in RPMI medium supplemented with additional amino acids for 2 d. Final concentration of each amino acid indicated above histograms. Data are representative of two experiments.
(E) CFSE dilution of WT and Tax1bp1−/− CD4+ T cells stimulated as in (A) with indicated concentrations of L-cys for 2 days.
(F) Representative forward scatter area analysis of WT or Tax1bp1−/− CD4+ T cells stimulated as in (A) with or without L-cys.

