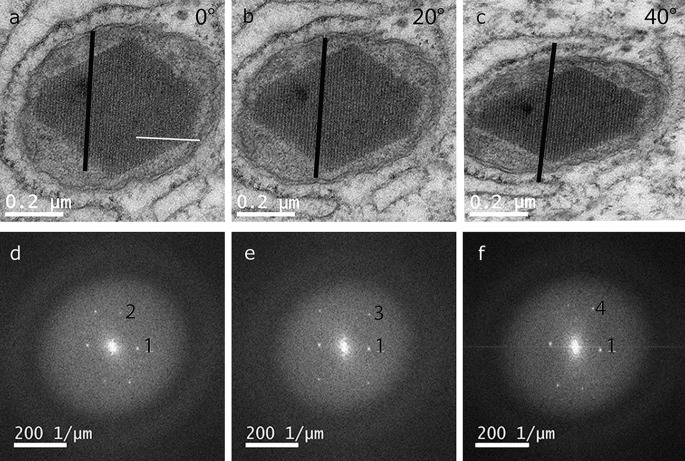
Fig. 3.
Tilted TEM images and Fourier transform. a–c TEM lattice plane images of a crystal in mitochondria taken at different orientations (a 0°, b 20°, c 40°) by systematic tilting around the white line. While one plane (parallel to the black line) is kept edge on, the 2-dimensional projections show different periodic structures. d–f The corresponding Fourier transform images of the electron micrographs show several spots whose distance from the centre is inversely related to the lattice plane spacing. Due to the systematic tilting, spot 1 is present in all three images

