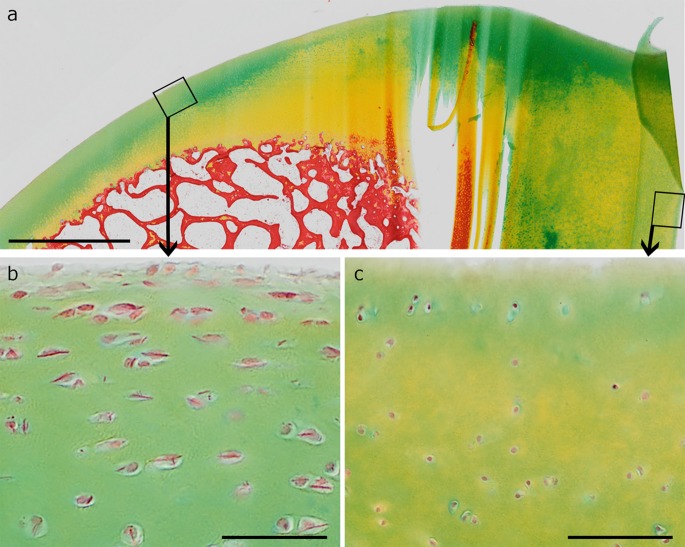
Fig. 8.
Movat staining of native articular cartilage with several morphological regions correlating with different frequency of crystals. The squares in the overview (a) indicate the area of magnification in b and c. b The thinner cartilage region with elongated chondrocytes in the superficial layer contain chondrocytes with crystals in almost every cell, whereas no crystals are visible in the thick cartilage region with mainly spherical chondrocytes up to the cartilage surface (c). Scale bars a 2 µm, b and c 50 µm

