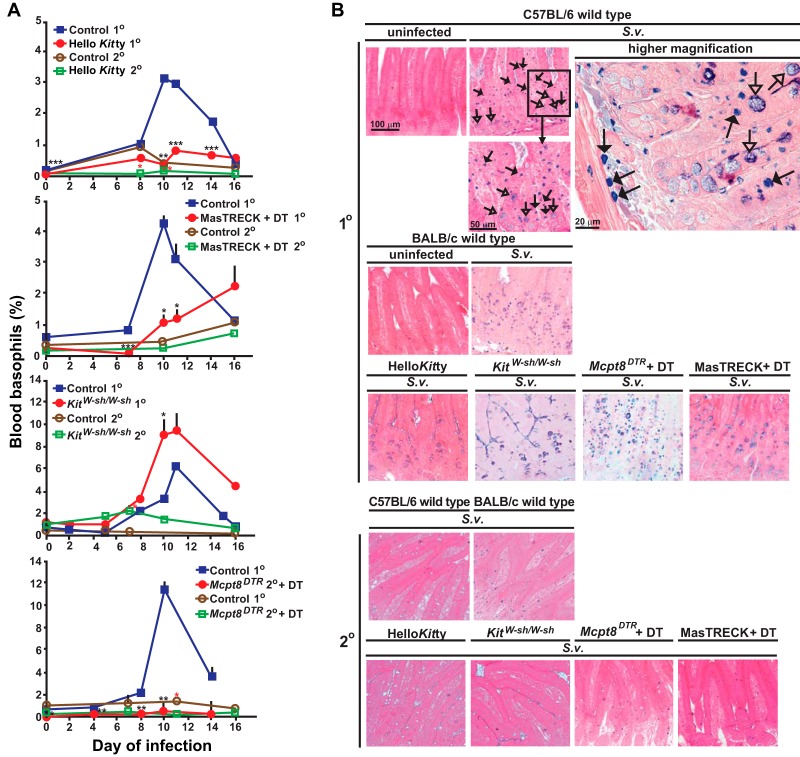
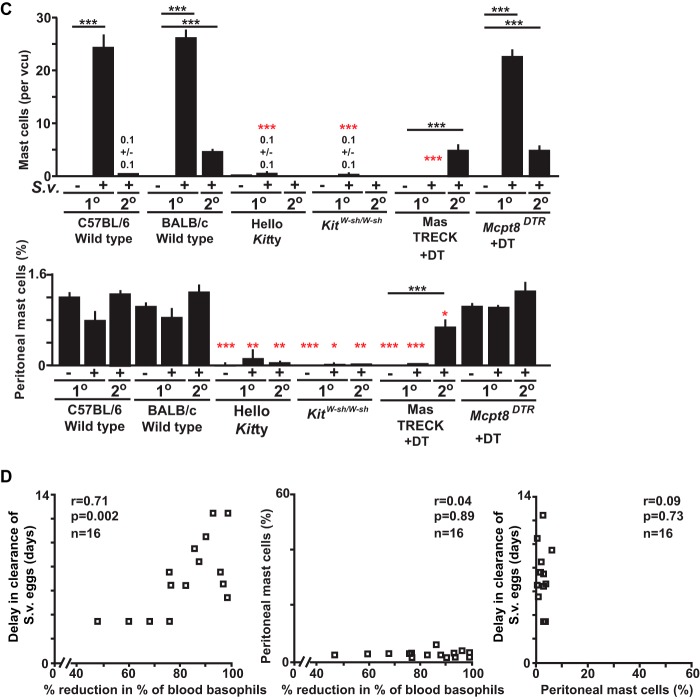
FIG 2.
Changes in numbers of basophils, mast cells, and epithelial goblet cells in wild-type and mast cell- and/or basophil-deficient mice during primary and secondary S. venezuelensis infections. (A) Blood was collected from each mouse at the indicated points after S. venezuelensis infection and stained with anti-IgE and anti-CD49b. Percentages of basophils in live cells were plotted. C57BL/6-Hello Kitty (n = 21) and control (n = 22) mice were analyzed in both the 1o and 2o infections (separate groups of 21 and 22 mice, for a total of 86 mice). Data for 1o infections include those from 16/21 Hello Kitty mice and all 22 control mice in the same 7 experiments performed as described for Fig. 1, as well as 5 additional Hello Kitty mice with 1o infections which were not used as described for Fig. 1. For basophil counts in 2o infections, data are shown from all of the Hello Kitty mice (n = 11) and control mice (n = 12) reported as described for Fig. 1 plus an additional 10 Hello Kitty and 10 control mice with 2o infections. Data represent results for BALB/c-MasTRECK mice treated with DT and control mice (a mixture of DT-treated wild-type mice [n = 5] and PBS-treated BALB/c-MasTRECK mice [n = 5]) (n = 10 each for both 1o and 2o infections, for a total of 40 mice), including 5 BALB/c-MasTRECK mice treated with DT and 4 control mice for the 1o infections and 5 BALB/c-MasTRECK mice treated with DT and 5 control mice for the 2o infections. Data represent results for C57BL/6-KitW-sh/W-sh (n = 14) and control (n = 18) mice (separate groups of 14 and 18 mice for the 1o and 2o infections, for a total of 64 mice), including 9 C57BL/6-KitW-sh/W-sh and 9 control mice from the 6 experiments performed as described for Fig. 1 for the 1o infections and 3 C57BL/6-KitW-sh/W-sh and 10 control mice from the 3 experiments performed as described for Fig. 1 for the 2o infections. Data for Mcpt8DTR mice treated with DT and control mice (a mixture of DT-treated wild-type mice [n = 3] and PBS-treated Mcpt8DTR mice [n = 3]) (n = 6 each) were from the 2 experiments performed as described for Fig. 1. ***, P < 0.0005; **, P < 0.005; *, P < 0.05; no asterisks, P > 0.05. Black asterisks (for 1o infections) or red asterisks (for 2o infections) indicate the statistical significance of results of comparisons between each type of mutant mouse and the corresponding control mice for that time point. (B and C) Jejunums were collected 14 days after 1o or 2o infections. (B) Mast cells (some indicated with filled arrows) were stained with alcian blue after fixation with Carnoy's solution (open arrows indicate goblet cells). Representative tissue images are shown in panel B, and numbers of mast cells per villus crypt unit (vcu) are shown as bar graphs in panel C (upper panel, means + SEM, n = 9 to 10 each; data pooled from 3 experiments). Peritoneal fluid was collected 14 days after the start of the 1o or 2o infections, and mast cells in live cells were assessed using anti-IgE and anti-c-Kit antibodies. Percentages of peritoneal mast cells in live cells are shown as bar graphs in panel C (lower panel, means + SEM, n = 3 to 10 each; data pooled from 2 or 3 experiments). Wild-type values for comparisons to those from mutant mice were combined from corresponding controls of the same strain (C57BL/6 or BALB/c). Black asterisks, statistical significance of results of comparisons of values for uninfected mice versus 1o or 2o infected mice in the same group (as indicated by bars). Red asterisks, statistical significance of results of comparisons of values for each type of mutant mouse and the corresponding wild-type mice for that condition (i.e., uninfected or 1o or 2o infected). Actual values are noted (means ± SEM) for low numbers; absence of a bar or of numbers means that none were detected. (D) (Left panel) Correlation between the delay in achieving cessation of egg excretion (defined as 0 egg count) in each Hello Kitty mouse (compared to the average number of days for cessation of egg excretion in the corresponding wild-type mice in each experiment) (y axis) and percent reduction in the percentage of blood basophils of individual Hello Kitty mice (calculated based on the average percentage of blood basophils in the corresponding control wild-type mice in each experiment) 10 to 12 days after initiation of 1o infection with S. venezuelensis (e.g., an 80% reduction means that that Hello Kitty mouse had 20% the average percentage of basophils in the corresponding wild-type mice in that experiment]) (x axis) (n = 16). (Middle panel) Correlation between the percentage of peritoneal mast cells in that Hello Kitty mouse 18 to 20 days postinitiation of 1o infection with S. venezuelensis (y axis) and the percentage of reduction in the percentage of blood basophils of individual Hello Kitty mice (defined as for left panel) (x axis) (n = 16). (Right panel) Correlation between the delay in achieving cessation of egg excretion in each Hello Kitty mouse (defined as for left panel) (y axis) and the percentage of peritoneal mast cells in that Hello Kitty mouse 18 to 20 days after initiation of 1o infection with S. venezuelensis (x axis) (n = 16). r, correlation coefficient. The data in each panel are from the same 16 Hello Kitty mice, all of them pooled from the data for the 16 mice in the 7 experiments performed as described for Fig. 1 for which data on basophils and peritoneal mast cells were obtained.


