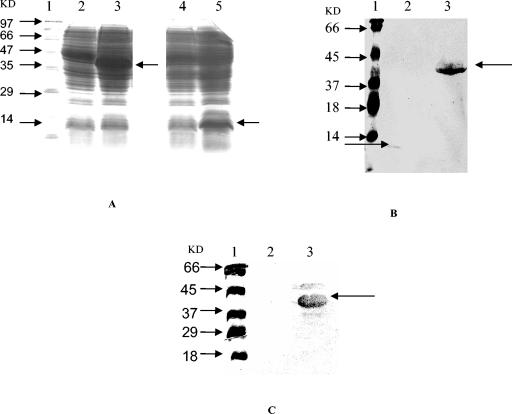
FIG. 2.
(A) SDS-PAGE showing the expression of P1-C1 and P1-N1 proteins in E. coli extracts. Lanes: 1, standard protein marker; 2, uninduced P1-C1; 3, induced P1-C1; 4, uninduced P1-N1; 5, induced P1-N1. (B and C) Western blot analysis of E. coli extracts showing the expression of P1-C1 and P1-N1 proteins with anti-histidine antibody (B) and with pooled patient sera (C). Lanes: 1, prestained protein marker; 2, induced P1-N1 (∼13.9 kDa); 3, induced P1-C1 (∼39.7 kDa).

