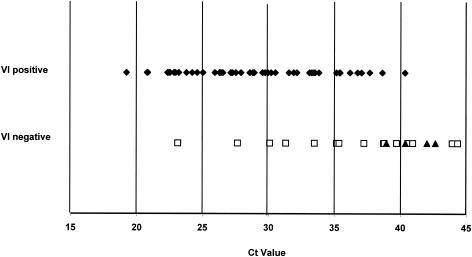
FIG. 2.
Relationship between (Ct) values of real-time PCR-positive samples and CSFV status of the samples. Filled diamonds represent samples that were positive by both CSFV RT-PCR assay and VI (n = 50). Empty squares represent samples that were CSFV RT-PCR assay positive, VI negative, and nested PCR positive (n = 15). Filled triangles represent false-positive samples. These samples were CSFV RT-PCR assay positive but negative by both VI and nested PCR (n = 4).

