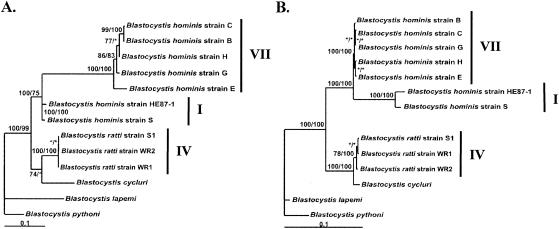
FIG. 2.
Comparison of unrooted maximum-likelihood trees inferred from SSU rRNA (A) and EF-1α (B) sequences for the same sample of Blastocystis isolates. EF-1α nucleotide sequences are available in the GenBank database (accession numbers AF090737, AF091356 to AF091365, AF223379, and D64080). The numbers at the nodes correspond to Bayesian posterior probabilities given as percentages (left of the slash) and percentages of occurrence in 10,000 quartet puzzling steps (right of the slash). Asterisks designate nodes with values of <50%. Scale bars, 0.1 substitutions (corrected) per site.

