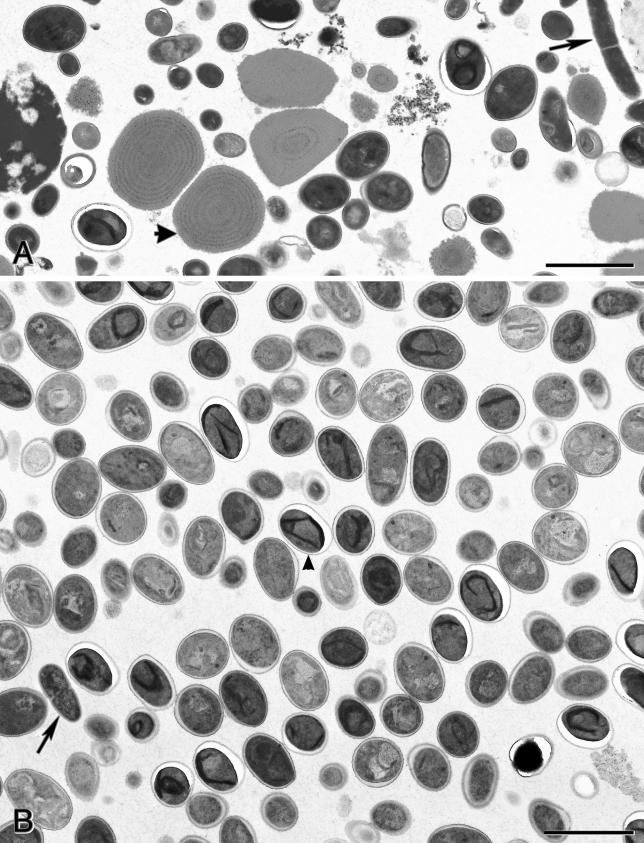
FIG. 3.
Transmission electron micrographs of material obtained after isopycnic Percoll and 40 to 60% (wt/wt) sucrose gradient centrifugations. (A) Material contained in band 2 (bottom band) of the isopycnic Percoll gradient centrifugation. Spores along with bacteria (arrow), possible food particles (arrowhead), and other contaminants are shown. (B) Material contained in the band just below the middle of the tube obtained following 40 to 60% (wt/wt) sucrose gradient centrifugation. Almost all microorganisms are spores (arrowhead), with some bacteria (arrow) and other contaminants (bottom right corner) detected. Bars, 2 μm.

