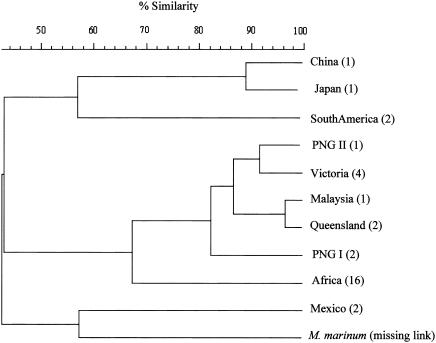
FIG. 2.
Dendrogram showing relationships among the 33 isolates. Cluster analysis was performed by the unweighted pair group method, using the arithmetic average algorithm with the Bionumerics version 3.0 computer software (Sint-Martens-Latem, Belgium). Percent similarity was calculated with the band-based Dice correlation coefficient. The numbers in parentheses represent the number of isolates tested.

