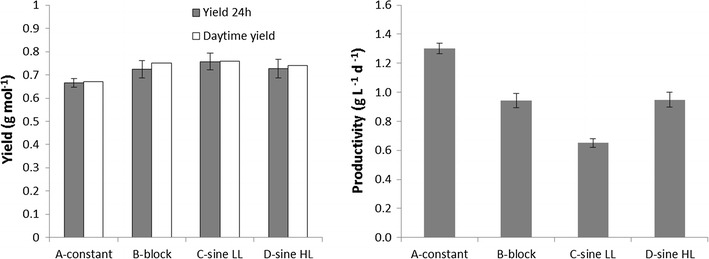
Fig. 4.

Yield and productivity of the cultures grown under continuous light and 16D8N cycles applied in block, sine LL and sine HL. Grey bars represent productivity and yield calculated over 24 h, using the biomass harvest of 3 days and error bars represent the variability (max–min/2) between triplicate measurements. White bars represent yield calculated over just the daytime period, using the O2 production rates
