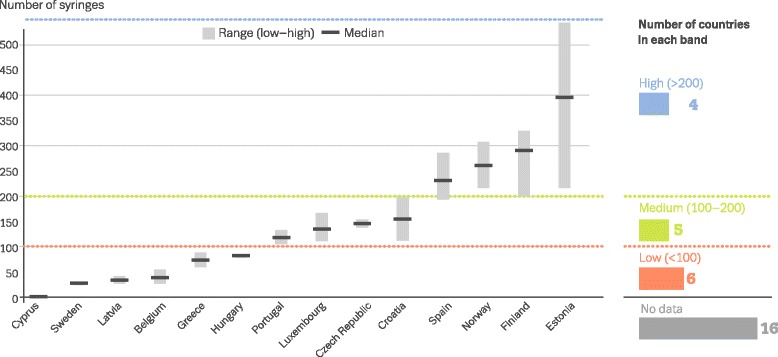
Fig. 2.

Estimated number of syringes provided annually through specialised programmes per person who injects drugs (EMCDDA 2016) [41]. Note: data displayed as uncertainty intervals and point estimates. Estimates are based on latest data available on syringe provision (2013–2014) combined with most recent estimates of PWID prevalence (2008–2014). Below red dotted line, low (<100); between red and green dotted lines, medium (100–200); above green dotted line, high (>200).
