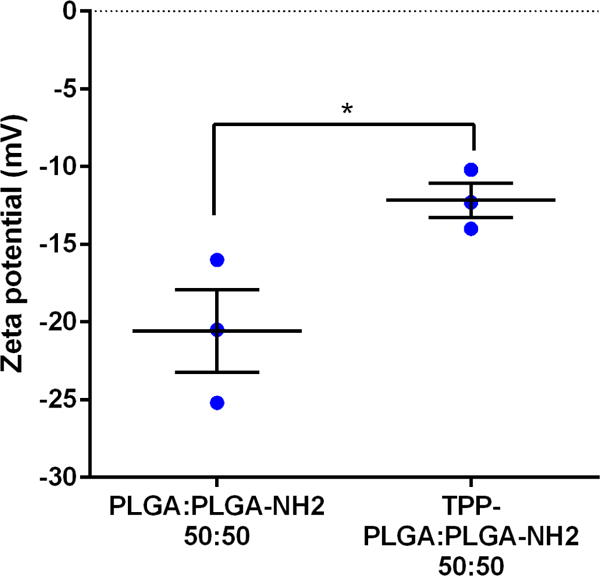
Figure 3. Zeta potential of particles before and after TPP conjugation.

PLGA: PLGA-NH2, 50:50represents particles prepared using a mixture of PLGA and PLGA-NH2 at the ratio of 50:50. TPP- PLGA: PLGA-NH2, 50:50 represents particles made from mixture of PLGA and PLGA-NH2 at the ratio of 50:50 with TPP conjugation. Data are expressed as scatter plots (n = 3). Unpaired two-tailed t-test was conducted to determine significant differences between PLGA: PLGA-NH2, 50:50 and TPP-PLGA: PLGA-NH2, 50:50.
*p < 0.05.
