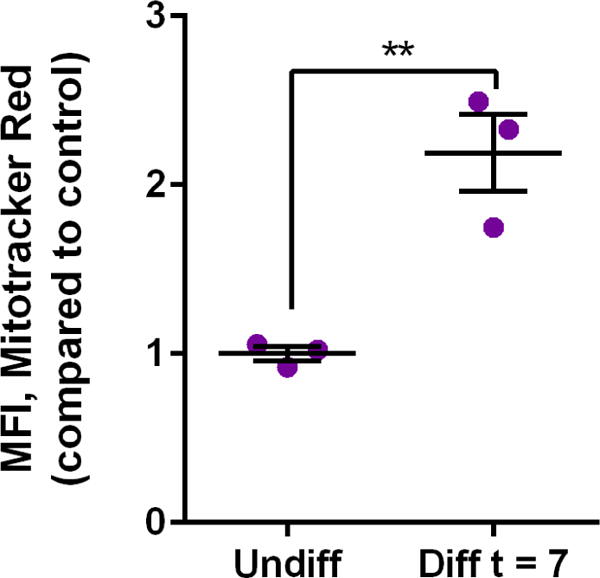
Figure 5. Relative mitochondrial mass as determined using Mitotracker® Red.

Relative mean fluorescence intensity (MFI) due to Mitotracker® Red comparing two groups of cells: H9c2 cells that were exposed to the differentiation agent, all-trans-retinoic acid, for 7 days (Diff t = 7) and H9c2 cells not treated with all-trans retinoic acid (Undiff). Data are expressed as scatter plots (n = 3). Unpaired two-tailed t-test was performed. **p < 0.01.
