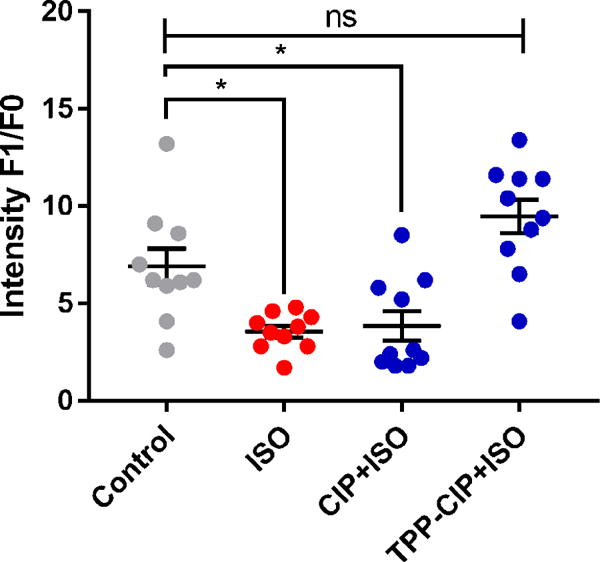
Figure 7. Effect of pretreatment with CIP at maintaining the mitochondria membrane potential in ISO-treated H9c2 cells.

TMRM intensity (F1/F0) obtained from epi-fluorescence images of H9c2 cells that were stained with TMRM dye after incubation with either CAMKIIN loaded particles (CIP) or TPP-conjugated CaMKIIN loaded particles (TPP-CIP) then treated with isoprenaline (ISO). F1 represents the raw intensity data. F0 represents the background intensity data which were obtained from the areas of the images that contained no cells. Control group is untreated cells. Data are expressed as scatter plots, (n = 10). One-way analysis of variance with Bonferroni’s multiple comparisons test compared to the control group was performed. *p < 0.05. ns, not statistically significant.
