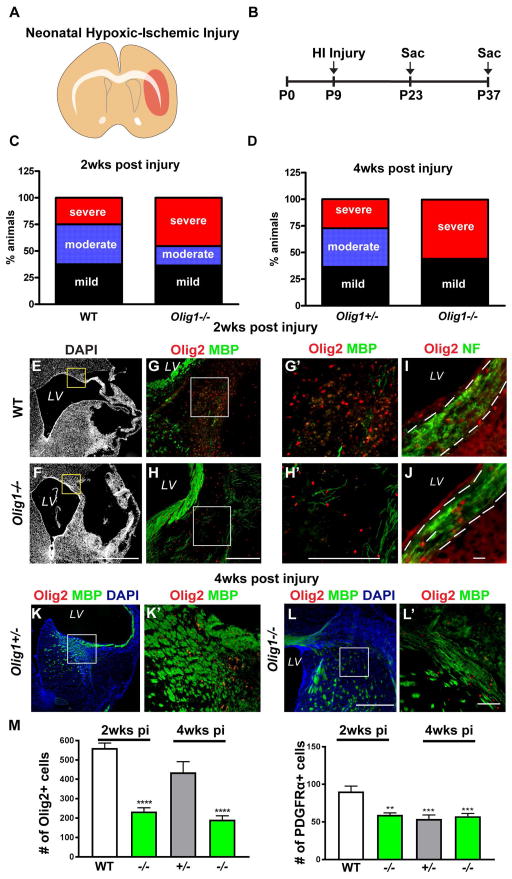
Figure 1. Deficient OPC recruitment and myelination in Olig1-null neonatal animals post injury.
(A) Cartoon illustrating neonatal HI injury in the brain. (B) Experimental timeline for neonatal HI injury. (C,D) Analysis of brain injury in wild type and Olig1-null animals two and four weeks post HI damage. Most of the brain injury in the Olig1-null animals two week post injury was classified as severe (46%), whereas the majority of injury in wild type animals was mild or moderate (38%). At four weeks, 56% of the Olig1-null animals showed severe injury compared to 27% of Olig1-heterozygous animals. The numbers of mice analyzed for C: wild type n=13; Olig1-null n=14 and for D: Olig1-heterozygous n = 11; Olig1-null n=14. (E,F) Low magnification DAPI image of wild type and Olig1-null animals with moderate brain injury. The box represents the region where the images in g–h were taken. (G–H) Merged image of Olig2 (red) and MBP (green) showing lack of myelin and reduced Olig2+ cells within the hypercellular lesion. Higher magnification views shown in G′–H′. (I–J) Representative images of Neurofilament (green) and Olig2 (red) immunostaining in the corpus callosum showing intact axons in the area of deficient OPCs. (K,L) Merged image of Olig2 (red), MBP (green) and DAPI (blue) in Olig1-heterozygous and Olig1-null animals four weeks post injury. Higher magnification views shown in K′–L′. (M) Cell counts of Olig2+ and PDGFRα+ cells in the corpus callosum two and four weeks post injury. Data are mean ± s.e.m; n≥4 animals per genotype; **P<0.01; ***P<0.001; ****P<0.0001; one-way ANOVA with Dunnett’s multiple comparison test. (F,H,H′,L,L′) scale bar = 50μm, (I–J) scale bar = 20μm.

