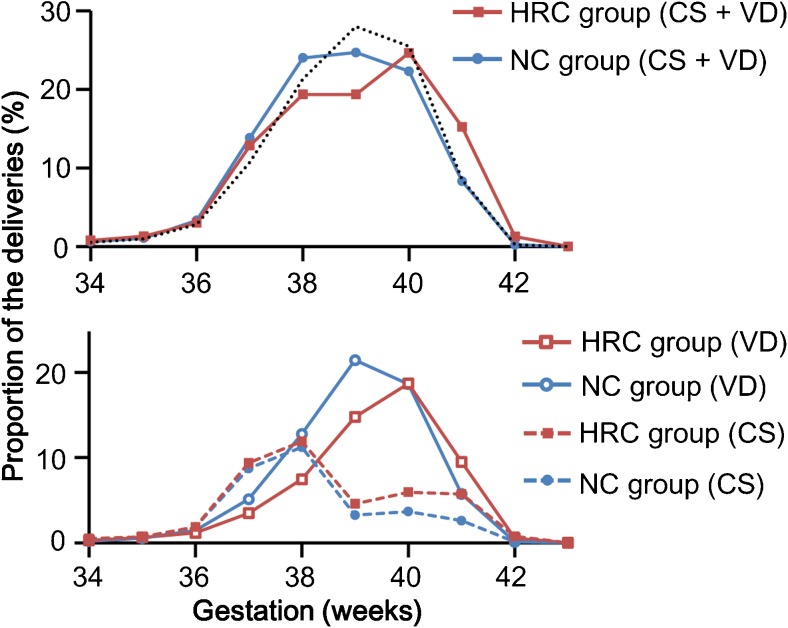
Fig. 2.
The distributions of the delivery in the natural ovulatory cycle (NC) and hormone replacement cycle (HRC) groups. The data are expressed as the proportion of the deliveries at the respective gestational ages (expressed in weeks) to all of the deliveries after at least 22 weeks of gestation. The blue and red lines indicate the proportions of deliveries in the NC and HRC groups, respectively. The black dotted line indicates the distribution of the delivery of all Japanese neonates in 2014. In the upper graph, the distributions of the delivery in the three groups were significantly different (Mann-Whitney U test, P < 0.001). Likewise, in the lower graph, the distributions of vaginal delivery (VD) and Cesarean section (CS) were significantly different between the NC and HRC groups (Mann-Whitney U test, P < 0.001)

