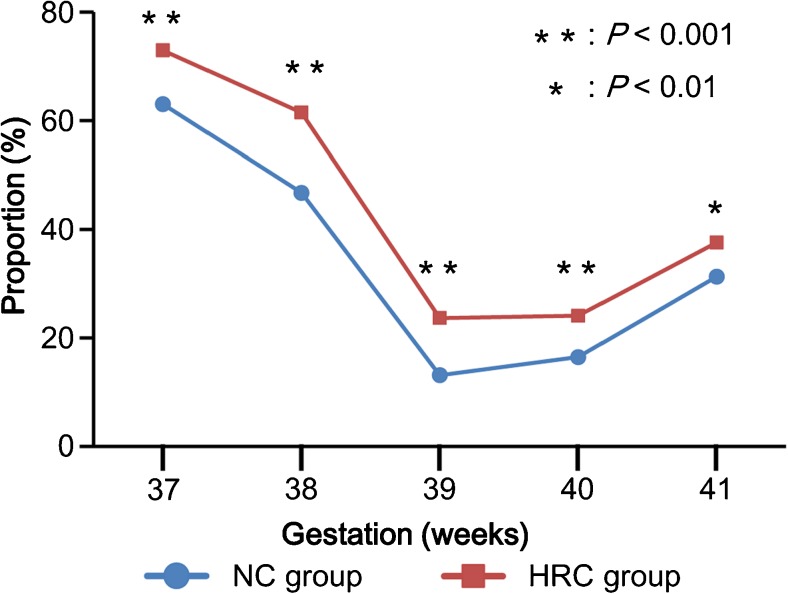
Fig. 3.
The rates of Cesarean sections at term for the natural ovulatory cycle (NC) and hormone replacement cycle (HRC) groups. The rates of Cesarean section were compared between the two groups at each week of gestation using the chi-squared test, and the statistically significant values are indicated with asterisks

