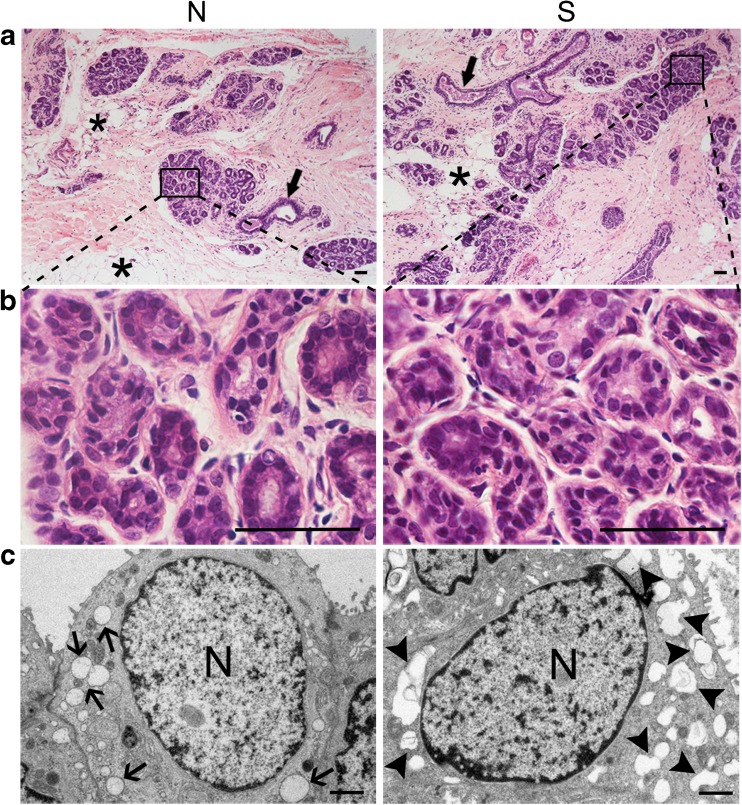
Fig. 2.
Structural analysis of the mammary gland: a–b HE staining showed that the mammary gland was normal in histology in both the superovulation group and normal group (duct: ; fat cells:
 ). Scale bar: 50 μm. c Irregularly shaped Golgi-derived secretory vesicles were observed in the acini of the superovulation group (normal secretory vesicle:
 ; irregularly shaped Golgi-derived secretory vesicles:
  ). Scale bar: 1 μm. S = superovulation group; N = normal group

