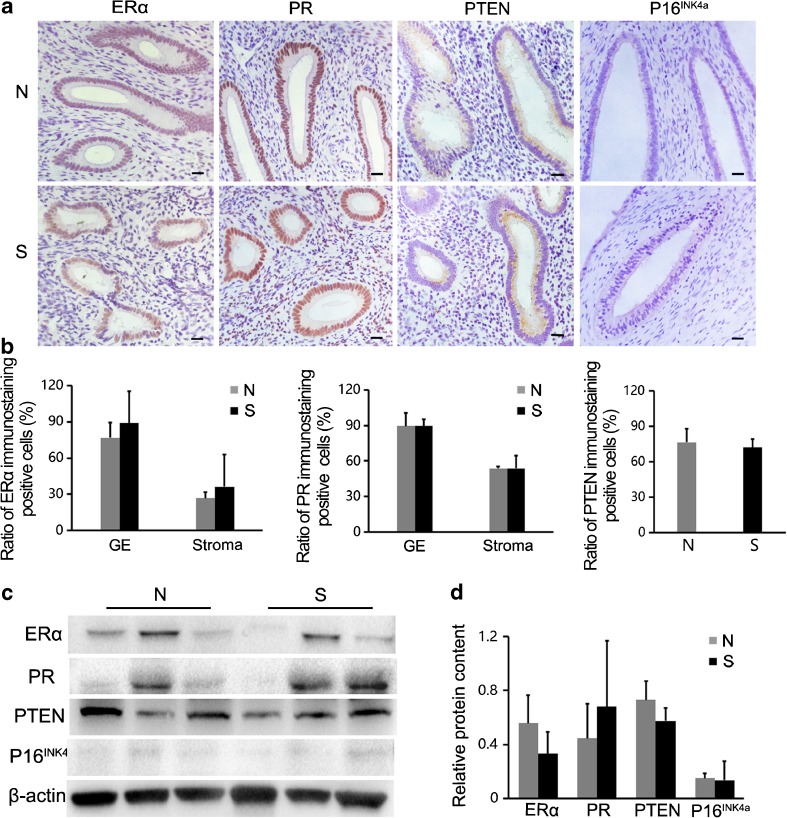
Fig. 7.
Cancer markers in the uterus: a–b Immunostaining detection of four uterine tumor molecular markers; the positive cell rates were not significantly different between the two groups (P > 0.05). Scale bar: 20 μm. c–d The expression of ERα, PR, PTEN and P16INK4a was analyzed by Western blot: their expression was not significantly different between the superovulation and normal groups (P > 0.05). S = superovulation group; N = normal group; GE = glandular epithelium

