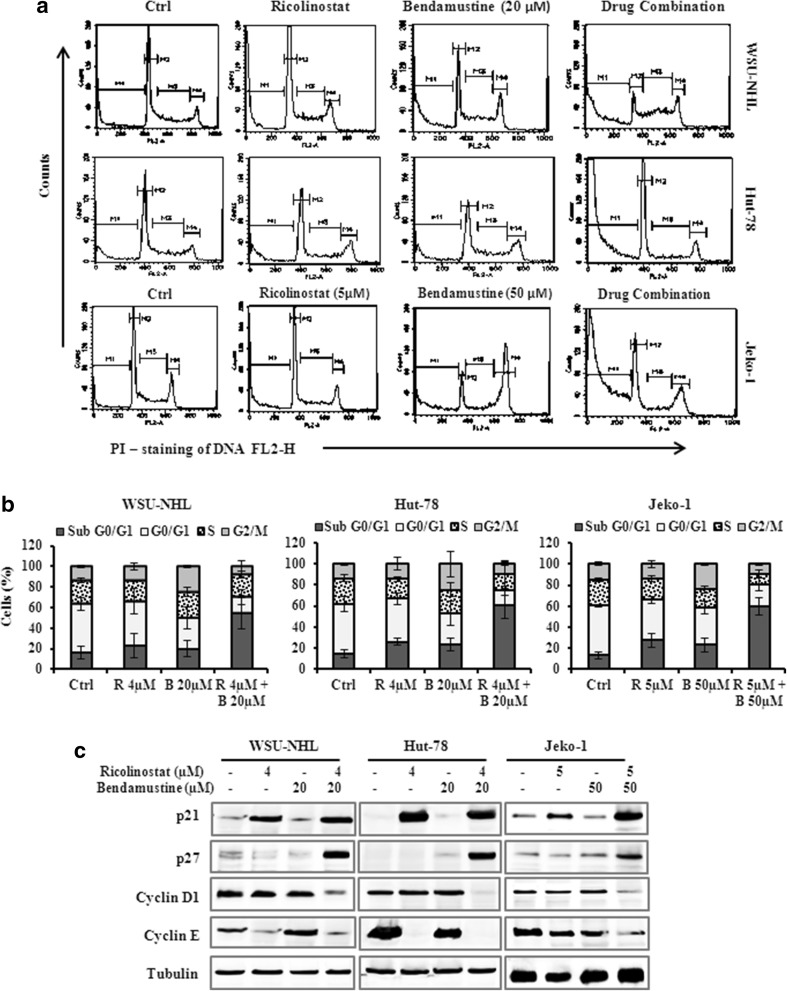
Fig. 3.
a Representative cell cycle profile of WSU-NHL, Hut-78 and Jeko-1 treated at the indicated doses for 24 h. The bars of M1, M2, M3 and M4 indicate the sub-G0/G1, G0/G1, S and G2/M phases, respectively. b cell cycle distribution (%) of lymphoma cell lines in different phases after 24 h of treatment. Values represent the mean ± SD of three independent experiments. c WSU-NHL, Hut-78 and Jeko-1 treated with the drugs alone or in combination for 24 h. Whole-cell lysates were subjected to Western blotting using the indicated Abs. Tubulin was used to normalize protein loading

