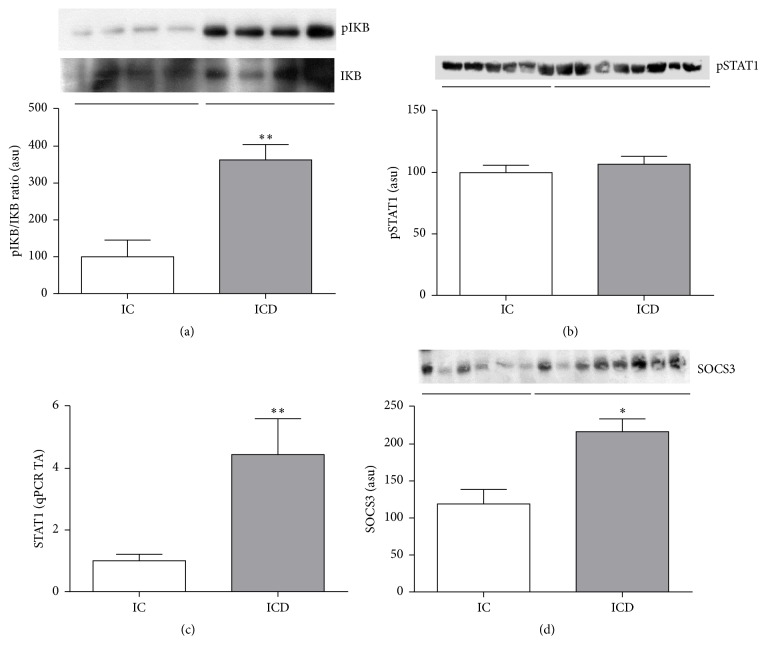
Figure 4.
Intestinal mucosa of Crohn's disease patients shows inflammation driven by NF-KB. Higher SOCS3 protein expression counterbalances the STAT1 activation. Western blot analysis of pIκB/IκB ratio (a), pSTAT1 (b), and SOCS3 (d) in intestinal mucosa of CD patients (ICD Group) compared to controls (IC Group). mRNA levels (qRT-PCR) of STAT1 (c) in intestinal mucosa of CD patients (ICD Group) compared to controls (IC Group). Each band represents one patient. For ICD, n = 10; for IC, n = 8; ∗p < 0.05, ∗∗p < 0.01, and ∗∗∗p < 0.001 versus control. ASU: arbitrary scanning unit; TA: transcription amount.

