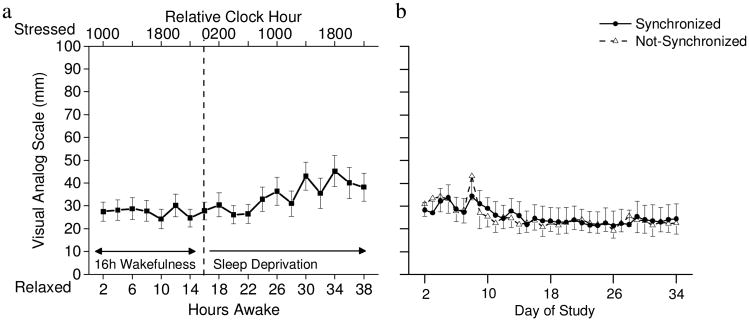
Fig 3. Stress ratings (a) bi-hourly during total sleep deprivation (n=17) and (b) average daily for synchronized (n=9) and not-synchronized (n=8) participants.
(a) Stress ratings were relatively stable across the first 24-h of wakefulness and were higher during the day of sleep deprivation. Dashed line indicates end of standard 16-h waking day and beginning of sleep deprivation. (b) Average daily stress ratings were similar for the synchronized and not-synchronize participants across the protocol. Note that day 8 shows average stress ratings during sleep deprivation for hours awake 25-40 on constant routine 1.

