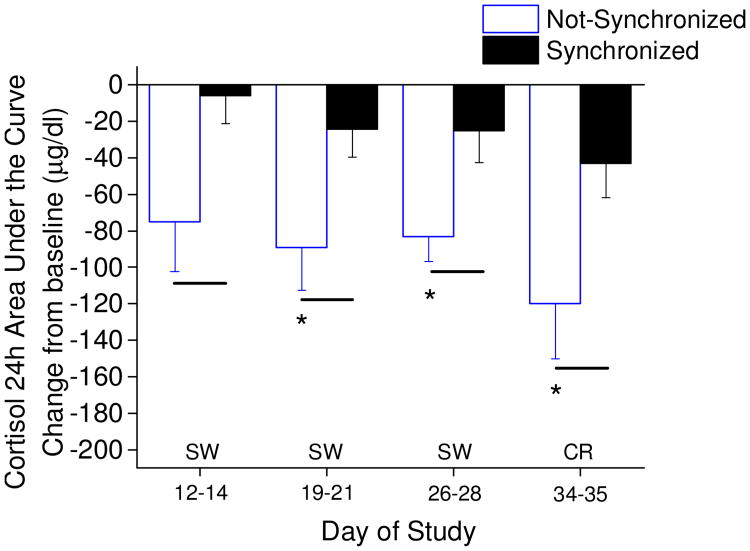
Fig. 6. Twenty-four hour cortisol area under the curve assessments.
Not-synchronized (n=5, 7, 7, 6; respectively for days of study shown) compared to the synchronized participants (n=7, 7, 6, 8; respectively for days of study shown). Lines denote significant differences in cortisol AUC between synchronized and not-synchronized groups (independent t-test; p<0.05); * denote significant reduction in cortisol AUC for the not-synchronized participants (single sample t-test difference from zero change; p< 0.05). Not-synchronized group difference from zero change on day 12-14 showed non-significant trend p=0.052, and synchronized group difference from zero change on day 34-35 showed non-significant trend p=0.053.

