Figure 1.

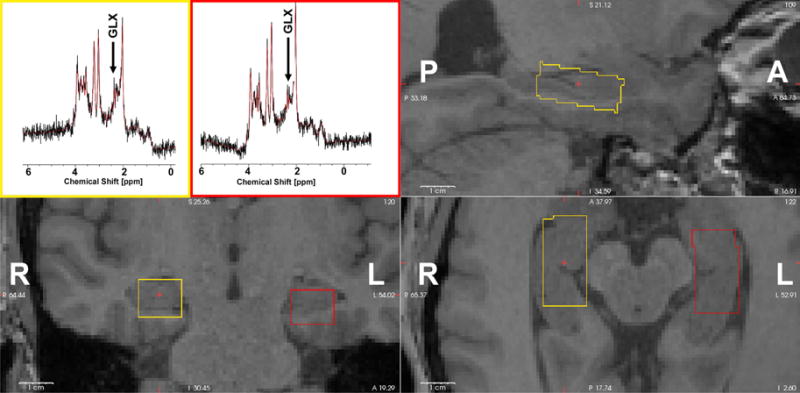
Representative spectra and voxel locations from one participant. Left hippocampus voxel is shown on axial, sagittal and coronal view (yellow). The right hippocampal MRS voxel is shown in red. A-anterior, P-posterior, L-left, R-right.

Representative spectra and voxel locations from one participant. Left hippocampus voxel is shown on axial, sagittal and coronal view (yellow). The right hippocampal MRS voxel is shown in red. A-anterior, P-posterior, L-left, R-right.