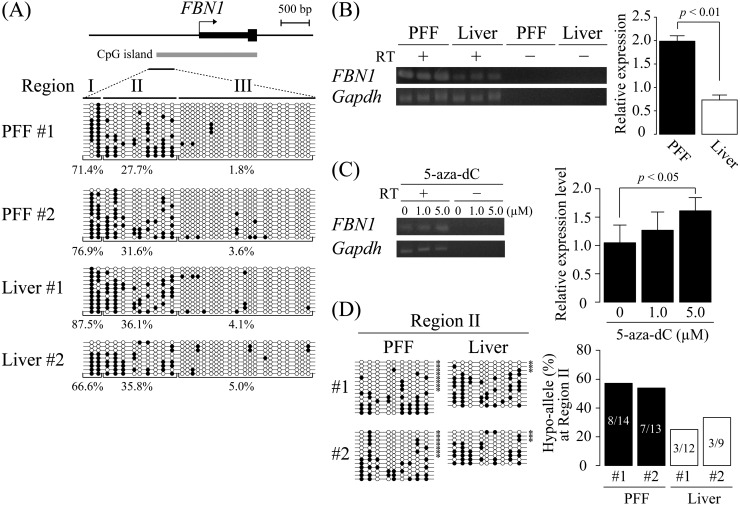
Fig. 1.
DNA methylation analysis of the porcine FBN1 CpG island shore. (A) DNA methylation status of the FBN1 CpG island shore within the FBN1 promoter region was analyzed by sodium bisulfite sequencing using two samples of porcine fetal fibroblast (PFF #1 and #2) and liver (Liver #1 and #2). The FBN1 CpG island shore was divided into three regions (Regions I, II, and III), and their DNA methylation levels (methylated CpGs/all CpGs) were calculated for each region. Open and closed circles indicate unmethylated and methylated CpGs, respectively. (B) FBN1 mRNA expression. FBN1 mRNA expression levels in PFF and the liver were assessed by RT-PCR. The relative expression levels were normalized to those of GAPDH. The expression levels are shown as mean ± SD (n = 3). Statistical comparisons of the expression levels were performed using the Student’s t-test. (C) FBN1 mRNA expression level was increased by 5-aza-dC treatment. FBN1 mRNA expression in PFF treated with 5-aza-dC (0, 1.0, or 5.0 µM) for 4 days was assessed by RT-PCR. The relative expression levels were normalized to that of GAPDH. The 5-aza-dC treatment with each dose was performed twice independently, and PCR for each sample was performed in triplicate independently. The expression levels are shown as mean ± SD, and statistical comparisons of the expression levels among the samples of 0, 1.0, 5.0 µM treatment were performed using the Student’s t-test with a Bonferroni correction. (D) Hypo-allele ratio of the Region II in the FBN1 CpG island shore. Based on the bisulfite sequencing data of the Region II in Fig. 1A, sequenced fragments that contain ≥ 75% unmethylated CpG sites (7–9 out of the 9 CpG sites in the Region II) were defined as Hypo-alleles (left panel), and the Hypo-allele ratio (Hypo-allele fragments/all sequenced fragments) was calculated (right panel). * Hypo-alleles in the sequenced fragments.

