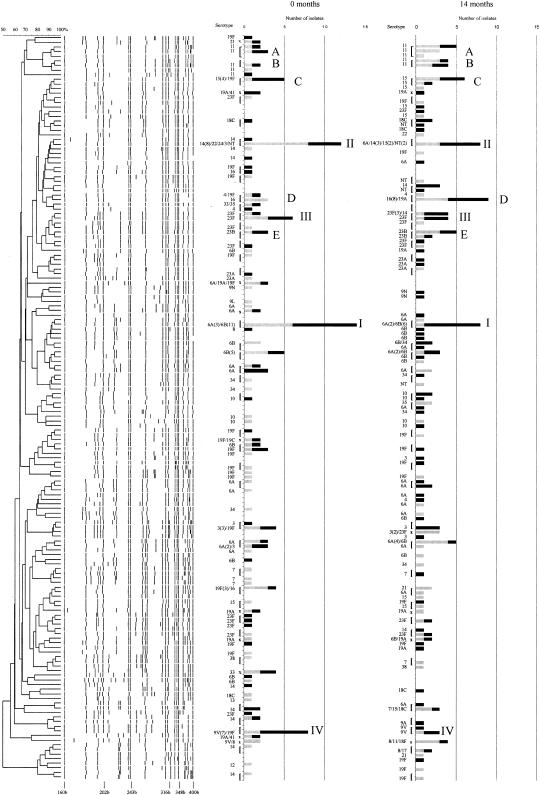
FIG. 1.
Population RFEL structure of the 180 and 186 pneumococcal isolates retrieved before vaccination (T = 0 months) and after pneumococcal conjugate vaccination (T = 14 months), respectively. Levels of genetic relatedness are depicted as percentages. The serotypes and numbers of isolates per genotype are shown in bars for the two periods separately. The contributions of PV children and CV children are shown in grey and black, respectively. I to IV, predominant clusters at the initial phase of the study; A to E, emerging clusters after conjugate vaccination. Clusters consisting of two or more RFEL genotypes are in parentheses. x, clusters of one RFEL genotype.

