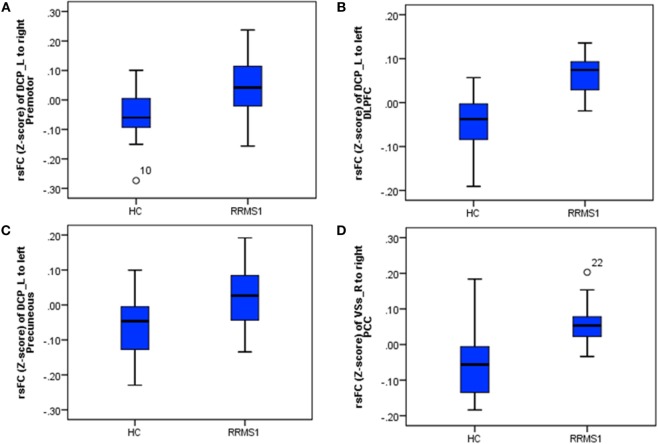
Figure 7.
The connectivity Z-scores of the main findings in RRMS1 patients and healthy controls (HCs), which were overlapped in the findings of the comparison between RRMS2 and HCs. (A–C) Z-scores of connectivity between the left dorsal caudal putamen (DCP) and right premotor area/left dorsal lateral prefrontal cortex (DLPFC)/left precuneus in HC and RRM1 groups. (D) Z-scores of connectivity between the right ventral striatum (VSs) and right posterior cingulate cortex (PCC) in HC and RRMS1 groups.

