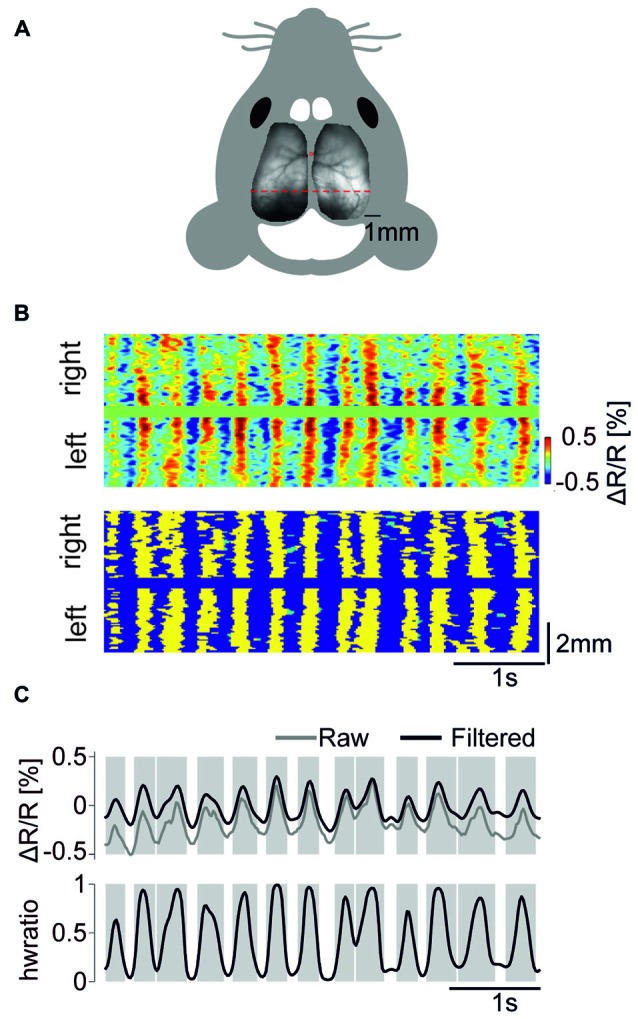
Figure 1.

Detection of global wave events (GWEs). (A) Fluorescence image of a transgenic mouse brain (mCitrine channel) mounted on schematic outline of the mouse head. (B) Upper panel. Scan of color coded, high-pass (>0.5 Hz) filtered voltage signals along the red dotted line in (A). Lower panel. Detected GWEs marked as yellow. Regions marked as green indicates depolarizing half wave events that were not classified as engaging in a GWE. (C) Upper panel. Voltage trace (raw signal in gray, high pass (>0.5 Hz) filtered in black), averaged across both hemispheres. Lower panel. Fraction of pixels of both hemispheres exhibiting depolarizing half waves. Gray shaded epochs indicate times of individual GWEs. Example data are from animal #6.
