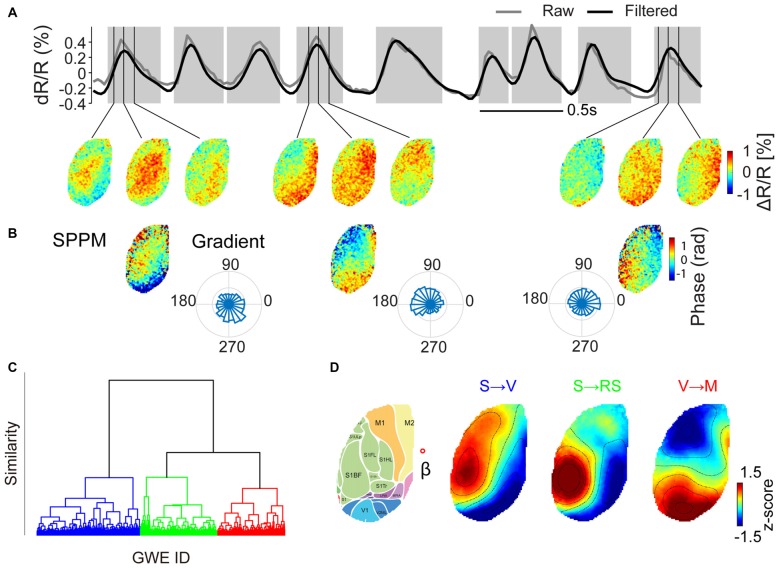
Figure 2.
Clustering of GWEs into distinct motifs. (A) Upper panel. The time course of voltage signal averaged across both hemispheres (raw signal in gray, high pass (>0.5 Hz) filtered signal in black). Epochs shaded in gray indicate times of individual GWEs. Lower panel. Voltage maps at times as indicated by vertical lines. (B) Spatial phase pattern maps (SPPMs), representing propagation direction of each event and probability distributions of directions of wave events, computed as mean local spatial gradients during GWE for each pixel. (C) Hierarchical cluster tree, obtained by hierarchical clustering applied to SPPMs to the whole dataset of animal #3 from deep anesthesia through awakening, recorded in one session (trees for the other five animals are shown in Supplementary Figure S1). The vertical axis indicates distance (similarity) between nodes. (D) SPPM cluster centroids for the case when all GWEs are classified into one of three motifs (“S → V”, “S → RS” and “V → M”), as indicated in different colors in (C). Right image shows the approximate location of cortical regions (Kirkcaldie, 2012), overlaid on the Citrine fluorescence image. Red open circle indicates the approximate location of Bregma (β) (Scale bars = 1 mm).

