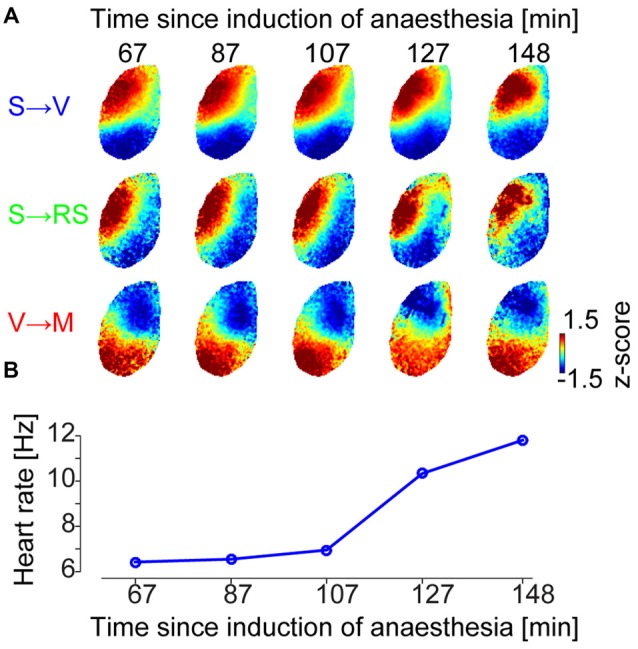
Figure 3.

Conserved repertoire of distinct wave motifs at different levels of anesthesia. (A) Centroids of SPPM clusters at different times between drug delivery and wakening (Example data from animal #2, centroids for the other five animals are shown in Supplementary Figure S3). Each centroid is normalized by its mean and standard deviation across pixels for visualization purpose. (B) Heartbeat frequency, as a proxy for wakefulness of the animal, represented as temporally aligned with (A).
