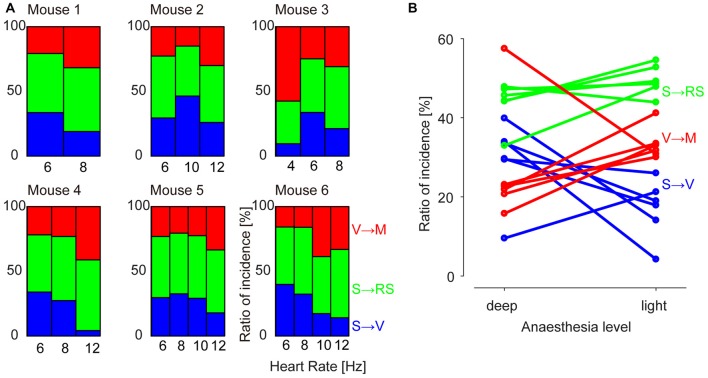
Figure 4.
Prevalence of motifs at different levels of anesthesia. (A) Percentage of incidence of occurrences of each motif (“S → V”, “S → RS” and “V → M”). Values are normalized to the total number of GWEs for each recording epoch. (B) Summary plot across animals and motifs. Each sample point represents incidence of a motif of an animal.

