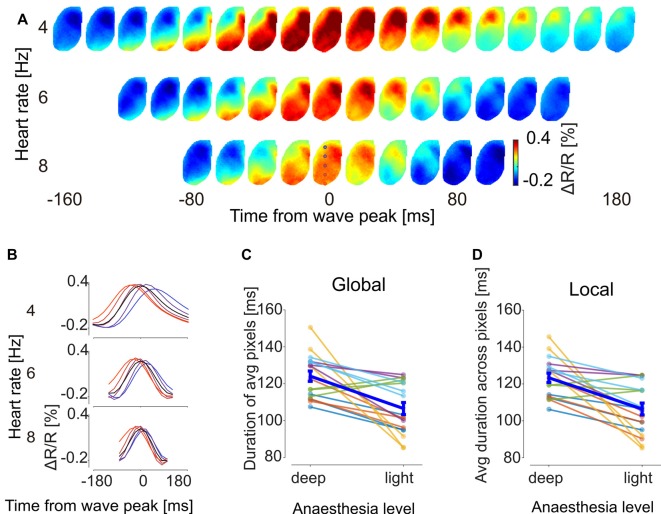
Figure 5.
GWE dynamics accelerate towards recovery from anesthesia. (A) Sequences of voltage maps at different levels of anesthesia. For each motif individual GWEs were aligned to their voltage peak time and averaged. Shown is motif “V → M” of animal #3 (full dataset shown in Supplementay Figure S4). Colored circles at 3rd row at 0 ms indicates location of pixels used to show time traces in (B). (B) Time traces of the aligned GWE shown in (A). Black traces and colored traces show spatial averages and individual pixel responses, respectively. (C) Global duration of the GWE, computed from time trace of average across pixels. Each sample point represents duration of a motif of an animal. (D) Local duration of the GWE, computed for each time trace of each pixel and then averaged across pixels.

