
Figure 2.
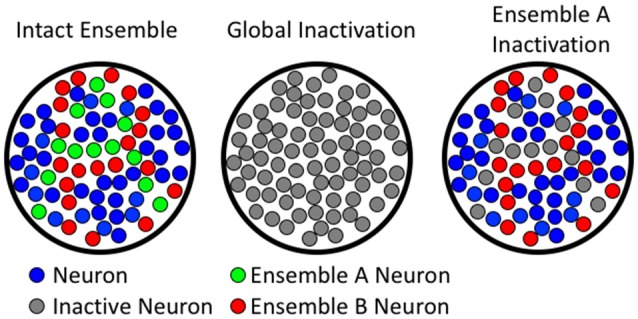
Comparing global to ensemble-specific inactivation. The left column shows hypothetical neuronal ensembles. The middle column illustrates that global inactivation inactivates all neurons (both ensemble A and B). The right column shows ensemble-specific inactivation of ensemble A, leaving ensemble B unaffected.