
FIGURE 5.
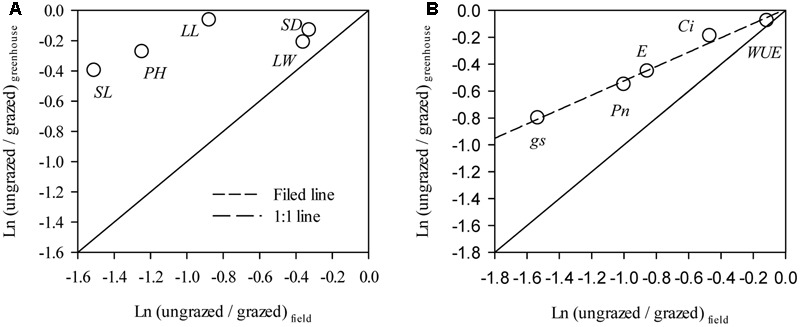
Comparisons between response in Leymus chinensis (A) morphological traits and (B) leaf photosynthetic traits to overgrazing in field and greenhouse experiments. The relationships for morphological traits (R2 = 0.47, P = 0.20) and leaf photosynthetic traits (R2 = 0.98, P < 0.001) between the responds ratios of field and greenhouse experiments were fitted by linear regression. PH, Plant height; LL, Leaf length; LW, Leaf width; SL, Stem length; SD, stem diameter; PN, Net photosynthetic rate; gs, Stomatal conductance; Ci, Intercellular carbon dioxide concentration; E, Transpiration rate; and WUE, water use efficiency. Data were log-transformed (base e) before analysis to improve normality.