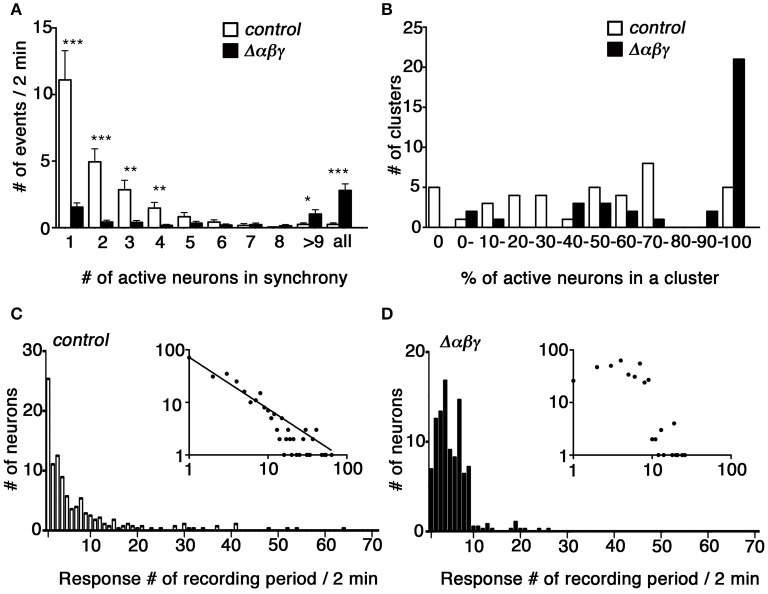
Figure 5.
Synchronous activity was higher in cultured Δαβγ hippocampal neuronal networks. (A) Histogram showing the frequency of calcium responses in which the number of neurons indicated in each bin responded in synchrony. Events when all neurons in a cluster responded in synchrony were compiled in the right-most “all” column. Error bars represent SEM, ***P < 0.0001, **P < 0.005, *P < 0.05 by Mann-Whitney U-test, n = 40 control (white) and 35 mutant (black) clusters for each of six independent cultures. (B) Histogram showing the percentage of active neurons in each cluster analyzed. The numbers in each bin indicate the percentage of active neurons and correspond to the lower limit range covered by each bin: 0 and 100% were assigned separate bars, and the range between 0 and 100% was divided into 10 bins. N = 40 clusters for control (white), and n = 35 mutant (black) clusters for six independent cultures each. (C,D) Histograms showing the distribution of the number of neurons with the calcium response frequency observed during a 2-min recording period. Insets show the same data plotted in log-log coordinates. A power-law distribution with a slope of −0.98 is indicated in the control graph. N = 280 control neurons and 385 mutant neurons for six independent cultures. Data derived from the Pcdhαβγ+/+:TGtaf7 and Pcdhαβγdel/+:TGtaf7 genotypes were used as controls.

