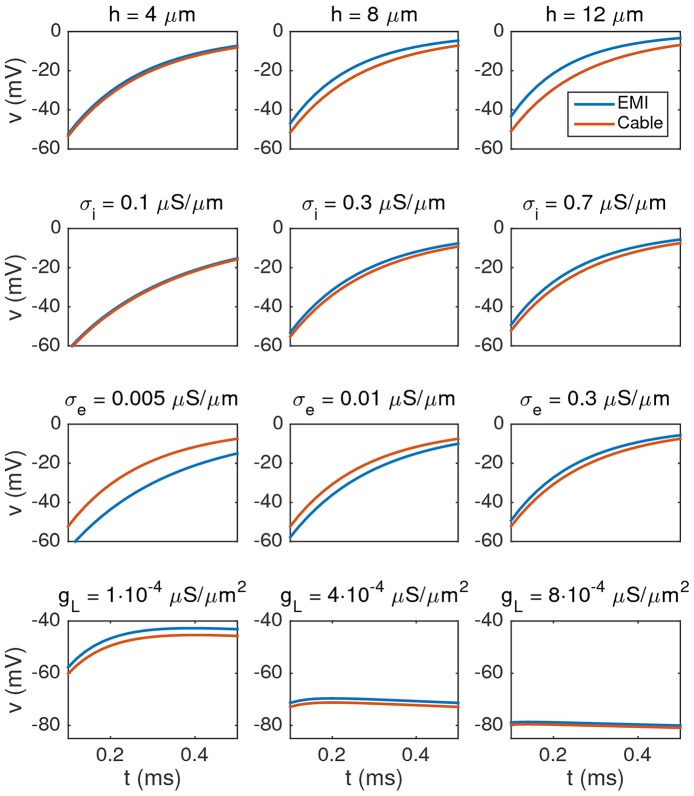
Figure 4.
Comparison of the membrane potential computed by solving the Cable equation (red) and the EMI model (blue) for some different values of h, σi, σe, and gL, where we recall that h = ly = lz (the width of the neuron). The plots show how the membrane potential in the compartment 25 μm from the start of the cell changes with time from t = 0.1 to 0.5 ms. The parameters used in the computations are given in Table 2 except for the values given above each plot. We observe that the difference between the two solutions increases when the value of h or σi is increased, and the difference decreases when the value of σe or gL is increased. Note that in order to observe any effect of changing the value of gL, we increase the default value by a factor of order 100–1,000 in the lower panel of the figure.

