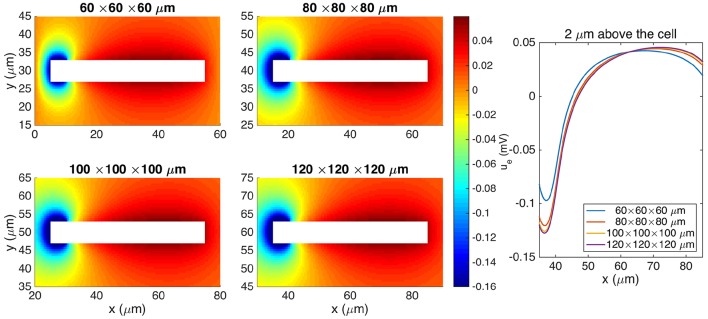
Figure 7.
Comparison of the extracellular potential around a neuron computed by the stationary EMI model for four different sizes of the extracellular domain. The plots to the left show the solution in a rectangle of size 60 × 30 μm on the plane in the center of the domain in the z-direction. The white area represents the neuron. The plot to the right shows the extracellular potential along a line 2 μm above the neuron in the y-direction and in the center of the domain in the z-direction. The parameters used in the computations are given in Table 2 except for Lx, Ly, and Lz, which are specified for each simulation, and gL, which is set to 3 · 10−5 μS/μm2.

