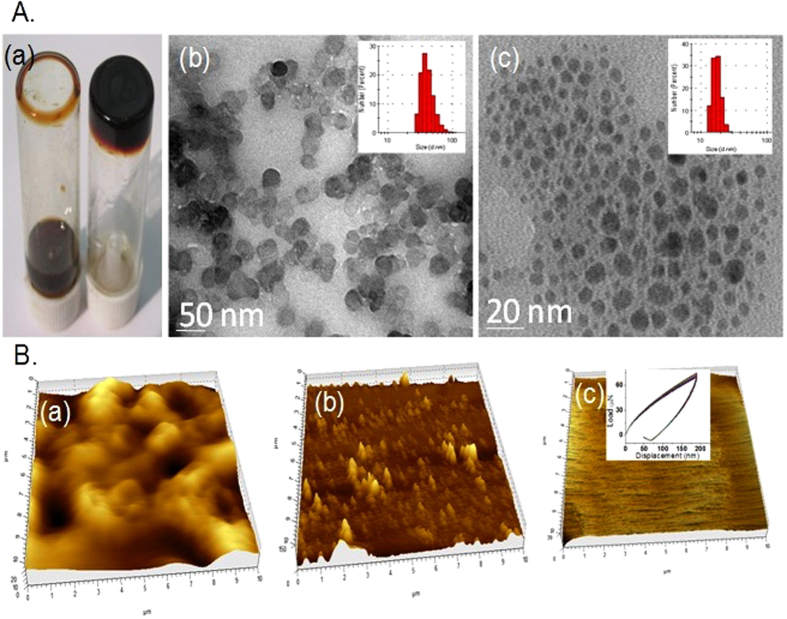
Figure 2. Different images are captured from hydrogel.
Visual images of lignin with water (left) and copolymer, lig-g-POZ with water, hydrogel (right) (A,a). HR-TEM images of aqueous lignin (A,b) and lig-g-POZ copolymer (A,c). Corresponding DLS histogram are given in inset of each TEM image. Atomic Force Microscopic view of lignin (B,a), lig-g-POZ copolymer (B,b). AFM images of lig-g-POZ copolymer spin coated thin film (B,c) and nanoindentation measurement for hardness is given in inset.

