Figure 1.
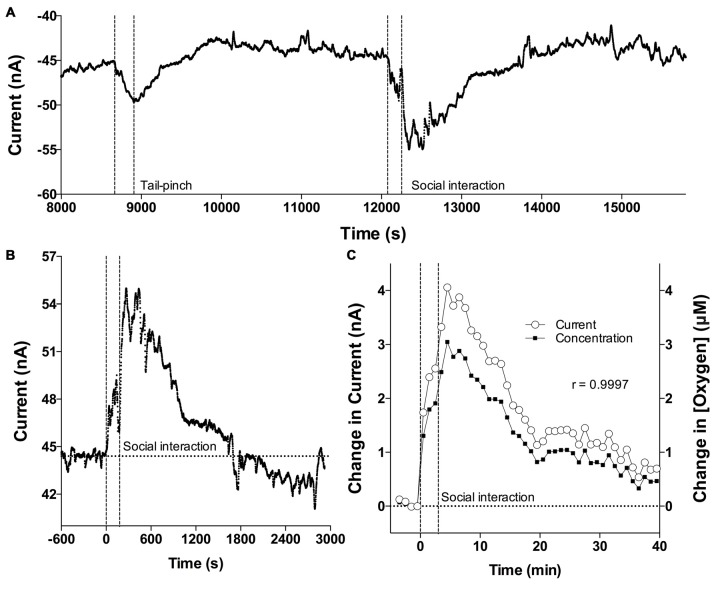
Oxygen current recording and correlation of oxygen currents and oxygen concentrations. (A) Original example of changes in reduction current induced by tail-pinch and social interaction. (B) Example of high resolution changes in oxygen current induced by social interaction and assessed with 1-s time resolution. (C) Mean changes in oxygen induced by social interaction assessed as current and concentration. Both assessments are highly correlative. Vertical hatched lines show onset and offset of stimuli.

