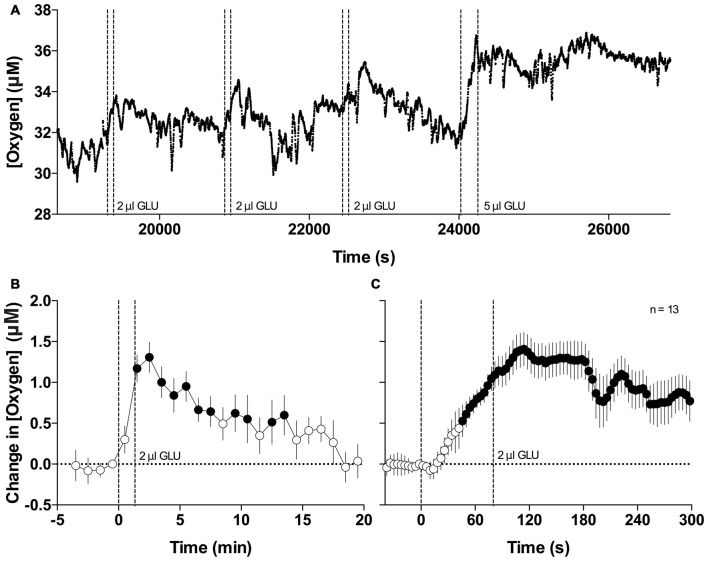
Figure 4.
Changes in NAc oxygen induced by intra-NAc glutamate (GLU) microinjections. (A) Original example of changes in NAc oxygen following repeated microinjections of GLU. (B) Mean (±SE) changes in NAc oxygen levels induced by GLU microinjections at 2 μl dose assessed at 1-min time resolution. (C) Mean (±SE) changes in NAc oxygen levels induced by GLU microinjections at 2 μl dose assessed at 4-s time resolution. Filled symbols show values significantly different from baseline as determined by one-way ANOVA. Vertical hatched lines show onset and offset of GLU injection.

