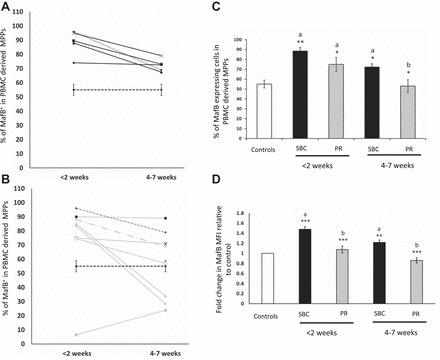
Fig. 3.

MafB+ cells in PBMC-derived MPPs (linneg CD34+ CD38+cells). In line graphs, y-axis represents the percentage of MafB-expressing cells in PBMC-derived MPPs, and x-axis represents weeks post burn from week 1 to week 7. Dashed black line represents means ± SE from control subjects. A: black lines represent percentage of MafB+ cells in SBC-treated patients. B: gray lines represent PR-treated patients. The numbers next to the lines represent each patient matching those in Table 1. C: bar graph shows means ± SE of MafB+ cells calculated as percentage of MPPs from controls, SBC, and PR patients from week 1 to week 7. D: fold change in mean fluorescent intensity of MafB in PBMC-derived MPPs from controls, SBC, and PR patients from <2 wk and 4–7 wk. Controls (n = 8), SBC (n = 5), PR (n = 8). ***P < 0.001, **P < 0.01, *P < 0.05. a vs. controls, b vs. SBC by one-way ANOVA.
