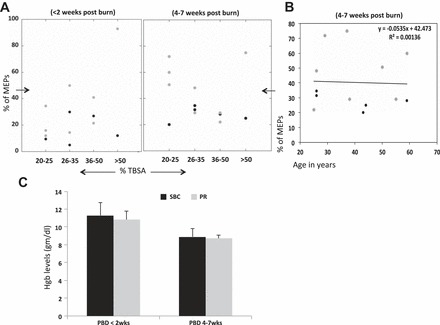
Fig. 4.

A: y-axis shows the percentage of MEPs in PBMC-derived MPPs at <2 wk and 4–7 wk post burn in SBC-treated (black points) and PR-treated (gray points) patients. The x-axis represents the percentage of total burn surface area (%TBSA). Percentage of MEPs and %TBSA are not correlated, as both groups have MEP levels distributed irrespective of %TBSA in both burn groups. B: y-axis shows the percentage of MEPs in PBMC-derived MPPs at 4–7 wk post burn in all burn patients, and x-axis represents the age distribution. Simple linear regression analysis shows no correlation between MEP levels and age parameter as the coefficient of determination (R2) = 0.0014. C: mean hemoglobin (Hgb) levels in SBC (black) and PR (gray) patients on <2 wk and 4–7 wk post burn. No differences in Hgb levels were observed in the two patient groups while significantly lower than reference range.
